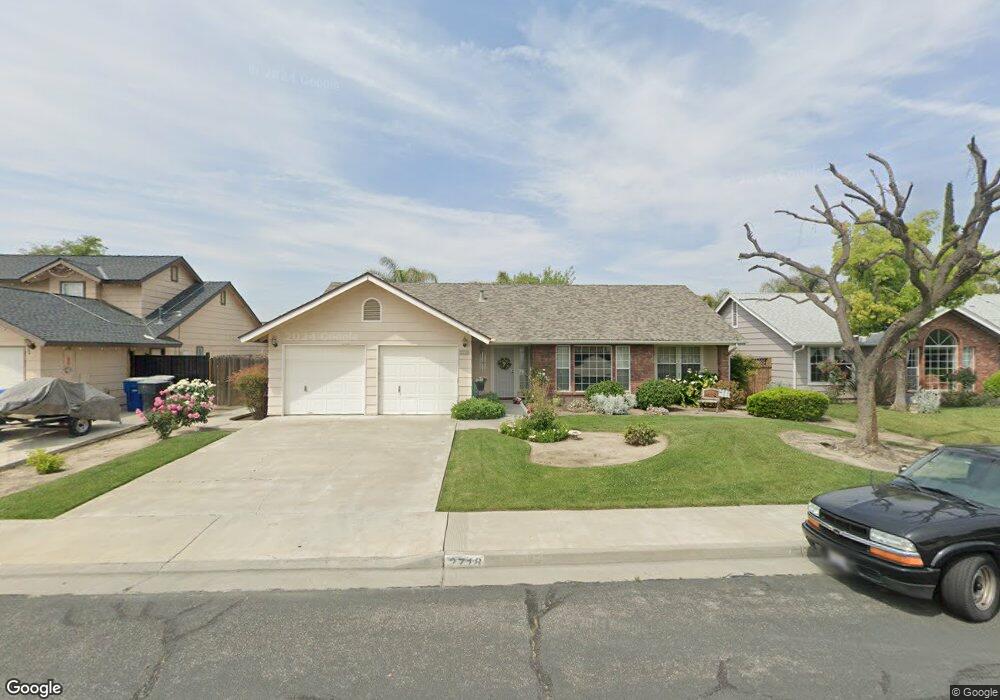
2718 Stratford Ct Hanford, CA 93230
Estimated Value: $404,901 - $433,000
3
Beds
2
Baths
1,919
Sq Ft
$218/Sq Ft
Est. Value
About This Home
This home is located at 2718 Stratford Ct, Hanford, CA 93230 and is currently estimated at $418,225, approximately $217 per square foot. 2718 Stratford Ct is a home located in Kings County with nearby schools including Hanford West High School, Frontier Elementary School, and Pioneer Middle School.
Ownership History
Date
Name
Owned For
Owner Type
Purchase Details
Closed on
Aug 2, 2022
Sold by
Revocable Trust
Bought by
Keislar Partners Llc
Current Estimated Value
Purchase Details
Closed on
Jun 10, 2022
Sold by
Evan R And Janet L Keislar Living Trust
Bought by
Bruce H Boyer And Helen J Boyer Revocable Fam
Purchase Details
Closed on
May 28, 2022
Sold by
Evan Keislar Robert
Bought by
Revocable Trust
Purchase Details
Closed on
May 25, 2022
Sold by
Leeann Stonebreaker
Bought by
Keislar Robert E
Purchase Details
Closed on
Apr 27, 2021
Sold by
Keislar Janet Louise
Bought by
Evan R And Janet L Keislar Living Trust and Shedd
Purchase Details
Closed on
Oct 10, 2019
Sold by
Nelson James R and Nelson Lynne M
Bought by
Nelson Family Trust
Purchase Details
Closed on
Feb 18, 1999
Sold by
Keislar Evan R and Keislar Janet L
Bought by
Keislar Evan R and Keislar Janet L
Purchase Details
Closed on
Oct 6, 1998
Sold by
Shand Marioara
Bought by
Keislar Evan Rollo and Keislar Janet Louise
Create a Home Valuation Report for This Property
The Home Valuation Report is an in-depth analysis detailing your home's value as well as a comparison with similar homes in the area
Home Values in the Area
Average Home Value in this Area
Purchase History
| Date | Buyer | Sale Price | Title Company |
|---|---|---|---|
| Keislar Partners Llc | -- | None Listed On Document | |
| Bruce H Boyer And Helen J Boyer Revocable Fam | -- | None Listed On Document | |
| Revocable Trust | -- | None Listed On Document | |
| Keislar Robert E | -- | Kahn Soares & Conway | |
| Evan R And Janet L Keislar Living Trust | -- | -- | |
| Nelson Family Trust | -- | None Listed On Document | |
| Keislar Evan R | -- | -- | |
| Keislar Evan Rollo | $134,000 | Chicago Title Co |
Source: Public Records
Tax History Compared to Growth
Tax History
| Year | Tax Paid | Tax Assessment Tax Assessment Total Assessment is a certain percentage of the fair market value that is determined by local assessors to be the total taxable value of land and additions on the property. | Land | Improvement |
|---|---|---|---|---|
| 2025 | $4,141 | $384,948 | $78,030 | $306,918 |
| 2023 | $4,141 | $370,000 | $75,000 | $295,000 |
| 2022 | $2,189 | $197,960 | $44,319 | $153,641 |
| 2021 | $2,151 | $194,079 | $43,450 | $150,629 |
| 2020 | $2,077 | $192,088 | $43,004 | $149,084 |
| 2019 | $2,043 | $188,322 | $42,161 | $146,161 |
| 2018 | $2,030 | $184,629 | $41,334 | $143,295 |
| 2017 | $1,993 | $181,009 | $40,524 | $140,485 |
| 2016 | $1,884 | $177,459 | $39,729 | $137,730 |
| 2015 | $1,825 | $174,793 | $39,132 | $135,661 |
| 2014 | $1,837 | $171,369 | $38,365 | $133,004 |
Source: Public Records
Map
Nearby Homes
- 2702 Stratford Ct
- 2734 Stratford Ct
- 2717 Burl Ct
- 2701 Burl Ct
- 2717 Stratford Ct
- 2701 Stratford Ct
- 2733 Burl Ct
- 2750 Stratford Ct
- 669 Orange St
- 2733 Stratford Ct
- 655 Orange St
- 683 Orange St
- 2749 Burl Ct
- 2749 Stratford Ct
- 641 Orange St
- 697 Orange St
- 2766 Stratford Ct
- 2765 Burl Ct
- 627 Orange St
- 2702 Burl Ct