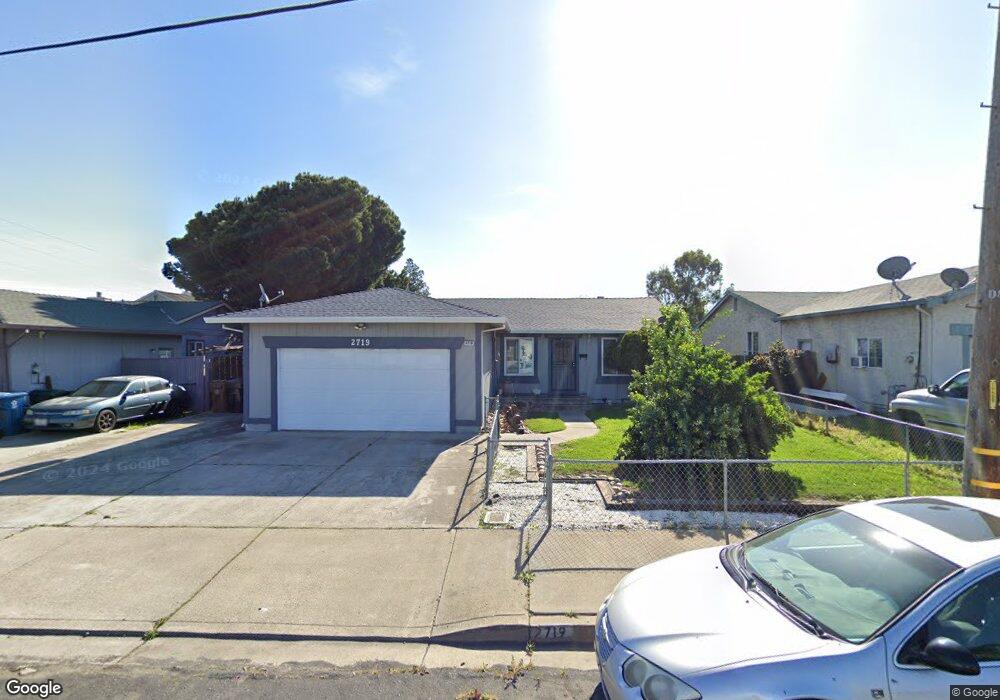
2719 E Tregallas Rd Antioch, CA 94509
Deer Valley NeighborhoodEstimated Value: $498,575 - $538,000
3
Beds
2
Baths
1,200
Sq Ft
$429/Sq Ft
Est. Value
About This Home
This home is located at 2719 E Tregallas Rd, Antioch, CA 94509 and is currently estimated at $515,394, approximately $429 per square foot. 2719 E Tregallas Rd is a home located in Contra Costa County with nearby schools including Belshaw Elementary School, Park Middle School, and Antioch High School.
Ownership History
Date
Name
Owned For
Owner Type
Purchase Details
Closed on
Jun 13, 2017
Sold by
Bronaugh Richard M
Bought by
Bronaugh Richard M and Hightower Jeanette L
Current Estimated Value
Purchase Details
Closed on
Dec 6, 1996
Sold by
Hud
Bought by
Bronaugh Richard M
Home Financials for this Owner
Home Financials are based on the most recent Mortgage that was taken out on this home.
Original Mortgage
$99,355
Outstanding Balance
$10,245
Interest Rate
7.86%
Mortgage Type
FHA
Estimated Equity
$505,149
Purchase Details
Closed on
Sep 11, 1996
Sold by
Norwest Mtg Inc
Bought by
Hud
Purchase Details
Closed on
Feb 20, 1996
Sold by
Johnson Ron
Bought by
Norwest Mtg Inc
Purchase Details
Closed on
Jun 20, 1994
Sold by
Carns Randy G and Carns Margaret L
Bought by
Johnson Ron
Home Financials for this Owner
Home Financials are based on the most recent Mortgage that was taken out on this home.
Original Mortgage
$137,960
Interest Rate
8.83%
Mortgage Type
Purchase Money Mortgage
Create a Home Valuation Report for This Property
The Home Valuation Report is an in-depth analysis detailing your home's value as well as a comparison with similar homes in the area
Home Values in the Area
Average Home Value in this Area
Purchase History
| Date | Buyer | Sale Price | Title Company |
|---|---|---|---|
| Bronaugh Richard M | -- | None Available | |
| Bronaugh Richard M | $100,500 | North American Title Co | |
| Hud | -- | Fidelity National Title Co | |
| Norwest Mtg Inc | $152,320 | Fidelity National Title Ins | |
| Johnson Ron | $140,000 | American Title Insurance Co |
Source: Public Records
Mortgage History
| Date | Status | Borrower | Loan Amount |
|---|---|---|---|
| Open | Bronaugh Richard M | $99,355 | |
| Previous Owner | Johnson Ron | $137,960 |
Source: Public Records
Tax History Compared to Growth
Tax History
| Year | Tax Paid | Tax Assessment Tax Assessment Total Assessment is a certain percentage of the fair market value that is determined by local assessors to be the total taxable value of land and additions on the property. | Land | Improvement |
|---|---|---|---|---|
| 2025 | $2,325 | $162,995 | $73,273 | $89,722 |
| 2024 | $2,258 | $159,800 | $71,837 | $87,963 |
| 2023 | $2,258 | $156,668 | $70,429 | $86,239 |
| 2022 | $2,228 | $153,598 | $69,049 | $84,549 |
| 2021 | $2,141 | $150,588 | $67,696 | $82,892 |
| 2019 | $2,098 | $146,124 | $65,689 | $80,435 |
| 2018 | $2,024 | $143,259 | $64,401 | $78,858 |
| 2017 | $1,891 | $140,451 | $63,139 | $77,312 |
| 2016 | $1,834 | $137,698 | $61,901 | $75,797 |
| 2015 | $1,807 | $135,631 | $60,972 | $74,659 |
| 2014 | $1,749 | $132,975 | $59,778 | $73,197 |
Source: Public Records
Map
Nearby Homes
- 4 Wightman Ct
- 12 Rossi Ave
- 23 E Madill St
- 2301 Beasley Ave
- 2844 Garrow Dr
- 2020 Crestwood Dr
- 2728 Capistrano St
- 2744 Capistrano St
- 1919 Birch Ave
- 2005 C St
- 1925 Alpha Way
- 1920 Glenwood Dr
- 2008 Cavallo Rd
- 0000 Phillips Ln
- 327 W 20th St Unit 329
- 431 Christina Ct
- 609 Lynn Ave
- 540 W Madill St
- 18 W 17th St
- 3112 View Dr
- 2715 E Tregallas Rd
- 2 E Tregallas Rd
- 2727 E Tregallas Rd
- 10 E Tregallas Rd
- 2714 E Tregallas Rd
- 2716 E Tregallas Rd
- 14 E Tregallas Rd
- 2710 E Tregallas Rd
- 2733 E Tregallas Rd
- 2728 E Tregallas Rd
- 18 E Tregallas Rd
- 2734 E Tregallas Rd
- 2739 E Tregallas Rd
- 2740 E Tregallas Rd
- 2710 Sunset Ln
- 2745 E Tregallas Rd
- 2706 Sunset Ln
- 2720 Sunset Ln
- 2700 Sunset Ln
- 2744 E Tregallas Rd