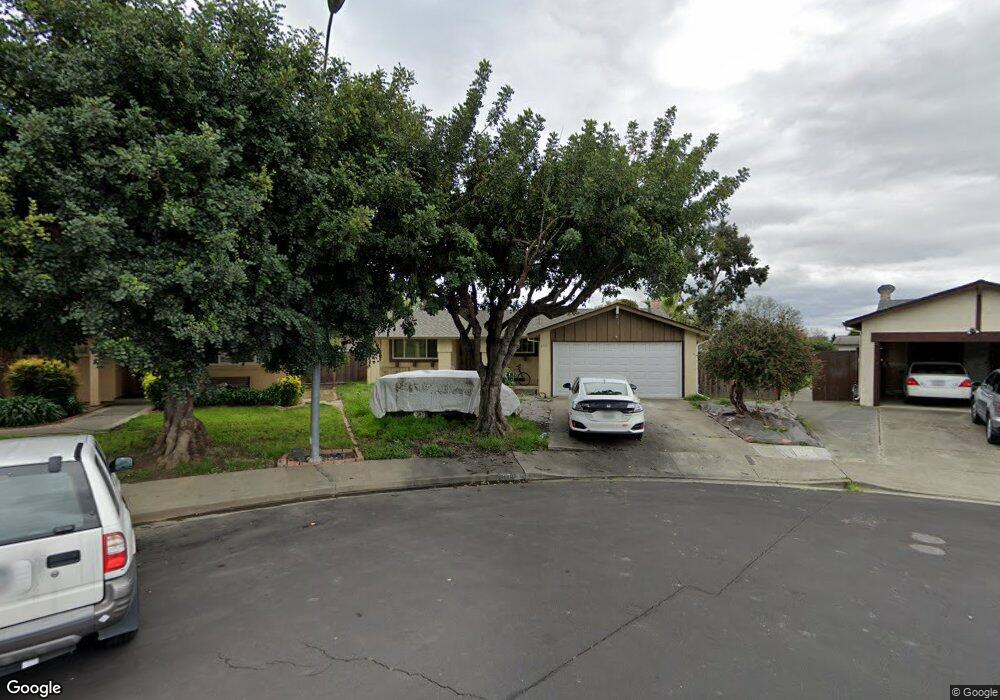
2719 Oak Tree Ct Union City, CA 94587
Downtown Union City NeighborhoodEstimated Value: $1,198,000 - $1,454,556
3
Beds
2
Baths
1,382
Sq Ft
$979/Sq Ft
Est. Value
About This Home
This home is located at 2719 Oak Tree Ct, Union City, CA 94587 and is currently estimated at $1,352,639, approximately $978 per square foot. 2719 Oak Tree Ct is a home located in Alameda County with nearby schools including Searles Elementary School, Cesar Chavez Middle School, and James Logan High School.
Ownership History
Date
Name
Owned For
Owner Type
Purchase Details
Closed on
Mar 1, 2013
Sold by
Wan Lifeng and Zhao Haiying
Bought by
Wan Lifeng and Zhao Haiying
Current Estimated Value
Home Financials for this Owner
Home Financials are based on the most recent Mortgage that was taken out on this home.
Original Mortgage
$278,000
Outstanding Balance
$190,114
Interest Rate
2.87%
Mortgage Type
New Conventional
Estimated Equity
$1,162,525
Purchase Details
Closed on
Apr 27, 2011
Sold by
Guffanti Jennifer and The Louis L Guffanti & Jennife
Bought by
Wan Lifeng and Zhao Haiying
Home Financials for this Owner
Home Financials are based on the most recent Mortgage that was taken out on this home.
Original Mortgage
$288,000
Interest Rate
3.12%
Mortgage Type
New Conventional
Purchase Details
Closed on
Jan 12, 2005
Sold by
Guffanti Jennifer and Louis L & Jennifer Guffanti Tr
Bought by
Guffanti Jennifer L and Guffanti Louis L
Purchase Details
Closed on
Jul 30, 1993
Sold by
Guffanti Jennifer and Hope Jennifer
Bought by
Guffanti Louis L and Guffanti Jennifer
Create a Home Valuation Report for This Property
The Home Valuation Report is an in-depth analysis detailing your home's value as well as a comparison with similar homes in the area
Home Values in the Area
Average Home Value in this Area
Purchase History
| Date | Buyer | Sale Price | Title Company |
|---|---|---|---|
| Wan Lifeng | -- | Chicago Title Company | |
| Wan Lifeng | $360,000 | Chicago Title Company | |
| Guffanti Jennifer L | -- | -- | |
| Guffanti Louis L | -- | -- |
Source: Public Records
Mortgage History
| Date | Status | Borrower | Loan Amount |
|---|---|---|---|
| Open | Wan Lifeng | $278,000 | |
| Closed | Wan Lifeng | $288,000 |
Source: Public Records
Tax History Compared to Growth
Tax History
| Year | Tax Paid | Tax Assessment Tax Assessment Total Assessment is a certain percentage of the fair market value that is determined by local assessors to be the total taxable value of land and additions on the property. | Land | Improvement |
|---|---|---|---|---|
| 2025 | $6,905 | $440,698 | $117,861 | $322,837 |
| 2024 | $6,905 | $432,060 | $115,551 | $316,509 |
| 2023 | $6,647 | $423,591 | $113,286 | $310,305 |
| 2022 | $6,536 | $415,286 | $111,065 | $304,221 |
| 2021 | $6,368 | $407,144 | $108,887 | $298,257 |
| 2020 | $6,370 | $402,971 | $107,771 | $295,200 |
| 2019 | $6,329 | $395,073 | $105,659 | $289,414 |
| 2018 | $6,175 | $387,329 | $103,588 | $283,741 |
| 2017 | $6,044 | $379,737 | $101,557 | $278,180 |
| 2016 | $5,904 | $372,294 | $99,567 | $272,727 |
| 2015 | $5,827 | $366,704 | $98,072 | $268,632 |
| 2014 | $5,588 | $359,521 | $96,151 | $263,370 |
Source: Public Records
Map
Nearby Homes
- 3184 Waugh Place
- 34926 Moina Shaiq Common
- 35415 Woodbridge Place
- 35383 Purcell Place
- 3155 Mackenzie Place
- 3134 Warwick Rd
- 34926 Osprey Dr
- 2224 Peacock Place Unit 3
- 2221 Partridge Way Unit 3
- 4027 Sunset Terrace
- 2421 Maraschino Place
- 2404 Maraschino Place
- 35560 Monterra Terrace Unit 301
- 3751 Ruskin Place
- 34917 Sea Cliff Terrace
- 1157 Silver St
- 34233 Atteridge Place
- 34179 Bowling Green Common
- 1020 Carnelian Terrace
- 35005 11th St
- 2715 Oak Tree Ct
- 2715 Oak Tree Ct
- 2723 Oak Tree Ct
- 2711 Oak Tree Ct
- 2707 Oak Tree Ct
- 35019 Daisy St
- 2727 Oak Tree Ct
- 2731 Oak Tree Ct
- 35021 Daisy St
- 2735 Oak Tree Ct
- 2703 Oak Tree Ct
- 2739 Oak Tree Ct
- 2759 Rose Bud Ct
- 2755 Rose Bud Ct
- 2743 Oak Tree Ct
- 2641 Daffodil Way
- 2751 Rose Bud Ct
- 35024 Daisy St
- 2763 Rose Bud Ct
- 35028 Daisy St