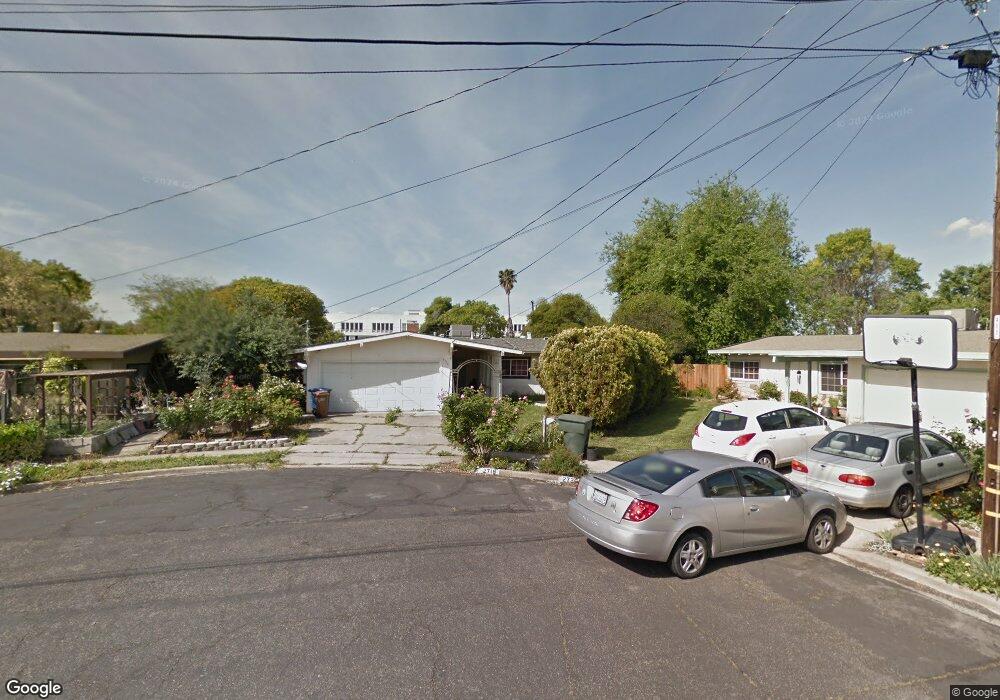
2719 Westgate Ct Concord, CA 94520
Buchanan Field NeighborhoodEstimated Value: $547,062 - $654,000
3
Beds
1
Bath
1,020
Sq Ft
$576/Sq Ft
Est. Value
About This Home
This home is located at 2719 Westgate Ct, Concord, CA 94520 and is currently estimated at $587,766, approximately $576 per square foot. 2719 Westgate Ct is a home located in Contra Costa County with nearby schools including Holbrook Language Academy, Valley View Middle School, and Mt. Diablo High School.
Ownership History
Date
Name
Owned For
Owner Type
Purchase Details
Closed on
Jul 19, 2012
Sold by
Galdon Javier
Bought by
Galdon Jacqueline Ramos
Current Estimated Value
Purchase Details
Closed on
Aug 5, 2004
Sold by
Ramos Galdon Jacqueline and Ramos Gonzalez Jacqueline
Bought by
Galdon Javier and Ramos Galdon Jacqueline
Home Financials for this Owner
Home Financials are based on the most recent Mortgage that was taken out on this home.
Original Mortgage
$67,000
Outstanding Balance
$33,599
Interest Rate
6.17%
Mortgage Type
Stand Alone Refi Refinance Of Original Loan
Estimated Equity
$554,167
Purchase Details
Closed on
May 8, 1995
Sold by
Gonzalez Jose J
Bought by
Ramos Gonzalez Jacqueline
Purchase Details
Closed on
May 21, 1994
Sold by
Ramos Jacqueline Fanny S and Gonzalez Jose J
Bought by
Gonzalez Jose J and Ramos Gonzalez Jacqueline
Home Financials for this Owner
Home Financials are based on the most recent Mortgage that was taken out on this home.
Original Mortgage
$104,000
Interest Rate
8.53%
Mortgage Type
Purchase Money Mortgage
Create a Home Valuation Report for This Property
The Home Valuation Report is an in-depth analysis detailing your home's value as well as a comparison with similar homes in the area
Home Values in the Area
Average Home Value in this Area
Purchase History
| Date | Buyer | Sale Price | Title Company |
|---|---|---|---|
| Galdon Jacqueline Ramos | -- | None Available | |
| Galdon Javier | -- | -- | |
| Ramos Gonzalez Jacqueline | -- | -- | |
| Gonzalez Jose J | -- | Placer Title Co |
Source: Public Records
Mortgage History
| Date | Status | Borrower | Loan Amount |
|---|---|---|---|
| Open | Galdon Javier | $67,000 | |
| Closed | Gonzalez Jose J | $104,000 |
Source: Public Records
Tax History Compared to Growth
Tax History
| Year | Tax Paid | Tax Assessment Tax Assessment Total Assessment is a certain percentage of the fair market value that is determined by local assessors to be the total taxable value of land and additions on the property. | Land | Improvement |
|---|---|---|---|---|
| 2025 | $3,151 | $202,639 | $90,062 | $112,577 |
| 2024 | $3,073 | $198,667 | $88,297 | $110,370 |
| 2023 | $3,073 | $194,772 | $86,566 | $108,206 |
| 2022 | $3,011 | $190,954 | $84,869 | $106,085 |
| 2021 | $2,921 | $187,210 | $83,205 | $104,005 |
| 2019 | $2,853 | $181,659 | $80,738 | $100,921 |
| 2018 | $2,735 | $178,098 | $79,155 | $98,943 |
| 2017 | $2,631 | $174,606 | $77,603 | $97,003 |
| 2016 | $2,534 | $171,183 | $76,082 | $95,101 |
| 2015 | $2,478 | $168,613 | $74,940 | $93,673 |
| 2014 | $2,331 | $165,312 | $73,473 | $91,839 |
Source: Public Records
Map
Nearby Homes
- 2082 Overhill Rd
- 2057 Highland Dr
- 2087 Brook St
- 2697 Mayfair Ave
- 2678 Mayfair Ave
- 1865 Overhill Rd
- 2838 Loma Vista Ave
- 2847 Avon Ave
- 2868 Avon Ave
- 2821 Ponderosa Dr
- 2830 Gillet Ave
- 2311 Crescent Dr
- 2250 Hickory Dr
- 2867 Gillet Ave
- 2219 Acacia Dr
- 2206 Gehringer Dr
- 2445 Maple Ave
- 3025 Gratton Way
- 2081 Olivera Rd Unit E
- 2065 Olivera Rd Unit D
- 2725 Westgate Ct
- 2713 Westgate Ct
- 2860 Richard Ave
- 2848 Richard Ave
- 2872 Richard Ave
- 2731 Westgate Ct
- 2707 Westgate Ave
- 2906 Richard Ave
- 2701 Westgate Ave
- 2737 Westgate Ct
- 2743 Westgate Ct
- 2912 Richard Ave
- 2918 Richard Ave
- 2749 Westgate Ave
- 2849 Richard Ave
- 2855 Richard Ave
- 2930 Lion Ct
- 2843 Richard Ave
- 2873 Richard Ct
- 2867 Richard Ave