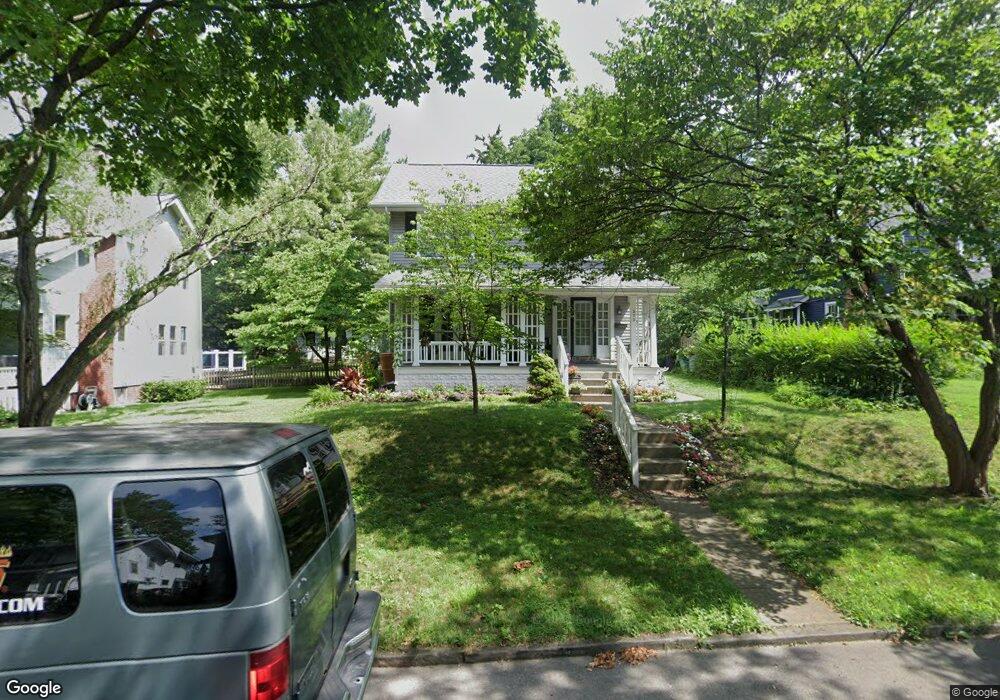
272 Brighton Rd Columbus, OH 43202
Clintonville NeighborhoodEstimated Value: $425,454 - $455,000
3
Beds
2
Baths
1,632
Sq Ft
$272/Sq Ft
Est. Value
About This Home
This home is located at 272 Brighton Rd, Columbus, OH 43202 and is currently estimated at $443,114, approximately $271 per square foot. 272 Brighton Rd is a home located in Franklin County with nearby schools including Clinton Elementary School, Dominion Middle School, and Whetstone High School.
Ownership History
Date
Name
Owned For
Owner Type
Purchase Details
Closed on
Dec 31, 2009
Sold by
Clark Joshua A and Clark Tamara A
Bought by
Goubeaux Jennifer L
Current Estimated Value
Home Financials for this Owner
Home Financials are based on the most recent Mortgage that was taken out on this home.
Original Mortgage
$100,000
Outstanding Balance
$64,227
Interest Rate
4.84%
Mortgage Type
Purchase Money Mortgage
Estimated Equity
$378,887
Purchase Details
Closed on
Nov 22, 2002
Sold by
Dill Kevin F
Bought by
Clark Joshua A and Clark Tamara M
Home Financials for this Owner
Home Financials are based on the most recent Mortgage that was taken out on this home.
Original Mortgage
$171,027
Interest Rate
6.38%
Mortgage Type
FHA
Purchase Details
Closed on
Sep 14, 1999
Sold by
Snyder Jane M
Bought by
Dill Kevin F
Home Financials for this Owner
Home Financials are based on the most recent Mortgage that was taken out on this home.
Original Mortgage
$112,000
Interest Rate
7.93%
Purchase Details
Closed on
Aug 6, 1987
Bought by
Snyder Jane M
Purchase Details
Closed on
Aug 1, 1978
Create a Home Valuation Report for This Property
The Home Valuation Report is an in-depth analysis detailing your home's value as well as a comparison with similar homes in the area
Home Values in the Area
Average Home Value in this Area
Purchase History
| Date | Buyer | Sale Price | Title Company |
|---|---|---|---|
| Goubeaux Jennifer L | $200,000 | Valmer Land | |
| Clark Joshua A | $172,500 | Chicago Title | |
| Dill Kevin F | $146,000 | Title First Agency Inc | |
| Snyder Jane M | $21,000 | -- | |
| -- | $44,600 | -- |
Source: Public Records
Mortgage History
| Date | Status | Borrower | Loan Amount |
|---|---|---|---|
| Open | Goubeaux Jennifer L | $100,000 | |
| Previous Owner | Clark Joshua A | $171,027 | |
| Previous Owner | Dill Kevin F | $112,000 |
Source: Public Records
Tax History
| Year | Tax Paid | Tax Assessment Tax Assessment Total Assessment is a certain percentage of the fair market value that is determined by local assessors to be the total taxable value of land and additions on the property. | Land | Improvement |
|---|---|---|---|---|
| 2025 | $5,523 | $123,060 | $48,230 | $74,830 |
| 2024 | $5,523 | $123,060 | $48,230 | $74,830 |
| 2023 | $5,452 | $123,060 | $48,230 | $74,830 |
| 2022 | $5,194 | $100,140 | $32,270 | $67,870 |
| 2021 | $5,203 | $100,140 | $32,270 | $67,870 |
| 2020 | $5,210 | $100,140 | $32,270 | $67,870 |
| 2019 | $4,546 | $74,940 | $24,850 | $50,090 |
| 2018 | $4,416 | $74,940 | $24,850 | $50,090 |
| 2017 | $4,543 | $74,940 | $24,850 | $50,090 |
| 2016 | $4,732 | $71,440 | $21,390 | $50,050 |
| 2015 | $4,296 | $71,440 | $21,390 | $50,050 |
| 2014 | $4,306 | $71,440 | $21,390 | $50,050 |
| 2013 | $2,094 | $70,420 | $20,370 | $50,050 |
Source: Public Records
Map
Nearby Homes
- 263 W North Broadway St
- 222 W North Broadway St
- 123 W Como Ave
- 84-86 W Como Ave
- 231 W Pacemont Rd Unit 235
- 27 E Dunedin Rd
- 30 E Torrence Rd
- 44 W Pacemont Rd
- 126 Erie Rd
- 3052 Dorris Ave Unit 3052
- 83 Clinton Heights Ave
- 116 E Dunedin Rd
- 94 W Tulane Rd
- 45 E California Ave
- 10 E Weber Rd Unit 402
- 723 Drummond Ct
- 3021 N High St
- 99 E Pacemont Rd
- 270 Clinton Heights Ave
- 29 Crestview Rd
- 280 Brighton Rd
- 264 Brighton Rd
- 258 Brighton Rd
- 286 Brighton Rd
- 290 Brighton Rd
- 273 W North Broadway St
- 257 W Broadway
- 257 W North Broadway St
- 248 Brighton Rd
- 251 W North Broadway St
- 296 Brighton Rd
- 277 Brighton Rd
- 271 Brighton Rd
- 277 W North Broadway St
- 281 Brighton Rd
- 267 Brighton Rd
- 245 W North Broadway St
- 261 Brighton Rd
- 242 Brighton Rd
- 287 Brighton Rd
Your Personal Tour Guide
Ask me questions while you tour the home.