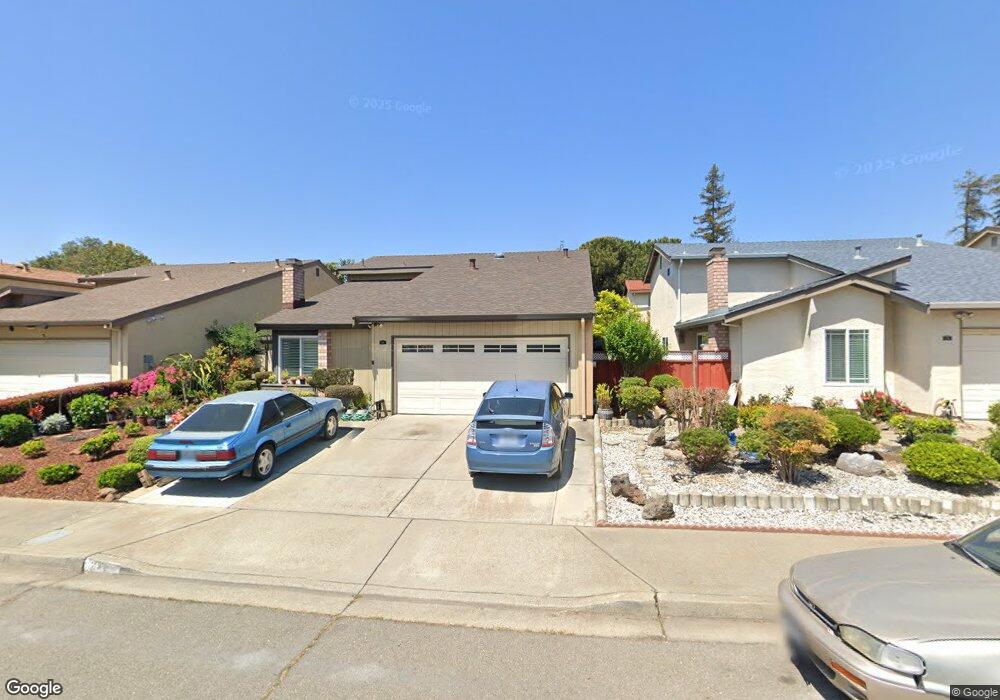
272 Ebony Way Hayward, CA 94544
Whitman-Wocine NeighborhoodEstimated Value: $866,000 - $947,000
4
Beds
3
Baths
1,592
Sq Ft
$571/Sq Ft
Est. Value
About This Home
This home is located at 272 Ebony Way, Hayward, CA 94544 and is currently estimated at $909,494, approximately $571 per square foot. 272 Ebony Way is a home located in Alameda County with nearby schools including Tyrrell Elementary School, Cesar Chavez Middle School, and Tennyson High School.
Ownership History
Date
Name
Owned For
Owner Type
Purchase Details
Closed on
Nov 17, 2017
Sold by
Rivac Felix M and Rivac Leticia C
Bought by
Calamaan Rivac Felix Mamaclay and Calamaan Rivac Leticia
Current Estimated Value
Purchase Details
Closed on
Mar 3, 1994
Sold by
Rivac Felix M and Rivac Leticia C
Bought by
Rivac Felix M and Rivac Leticia C
Create a Home Valuation Report for This Property
The Home Valuation Report is an in-depth analysis detailing your home's value as well as a comparison with similar homes in the area
Home Values in the Area
Average Home Value in this Area
Purchase History
| Date | Buyer | Sale Price | Title Company |
|---|---|---|---|
| Calamaan Rivac Felix Mamaclay | -- | None Available | |
| Rivac Felix M | $84,500 | -- |
Source: Public Records
Tax History
| Year | Tax Paid | Tax Assessment Tax Assessment Total Assessment is a certain percentage of the fair market value that is determined by local assessors to be the total taxable value of land and additions on the property. | Land | Improvement |
|---|---|---|---|---|
| 2025 | $5,184 | $414,136 | $126,340 | $294,796 |
| 2024 | $5,184 | $405,879 | $123,863 | $289,016 |
| 2023 | $5,107 | $404,784 | $121,435 | $283,349 |
| 2022 | $5,008 | $389,848 | $119,054 | $277,794 |
| 2021 | $4,966 | $382,068 | $116,720 | $272,348 |
| 2020 | $4,912 | $385,079 | $115,523 | $269,556 |
| 2019 | $4,949 | $377,529 | $113,258 | $264,271 |
| 2018 | $4,648 | $370,127 | $111,038 | $259,089 |
| 2017 | $4,369 | $348,134 | $104,440 | $243,694 |
| 2016 | $4,113 | $341,309 | $102,392 | $238,917 |
| 2015 | $4,032 | $336,183 | $100,854 | $235,329 |
| 2014 | $3,832 | $329,599 | $98,879 | $230,720 |
Source: Public Records
Map
Nearby Homes
- 298 Edwin Way
- 26589 Colette St
- 26937 Huntwood Ave
- 250 Schafer Rd
- 102 Fanuncio Ln
- 27777 E 12th St
- 27773 Pistachio Ct
- 27777 Pistachio Ct
- 744 Broadway St
- 25910 Westview Way
- 761 Shepherd Ave
- 26802 Lakewood Way
- 25231 Whitman St Unit 103
- 28538 Huntwood Ave
- 994 Westwood St
- 28315 Rochelle Ave
- 25525 Southwick Dr Unit 110
- 27796 Vasona Ct Unit 2
- 25495 Southwick Dr Unit 101
- 25085 Silverthorne Place
Your Personal Tour Guide
Ask me questions while you tour the home.