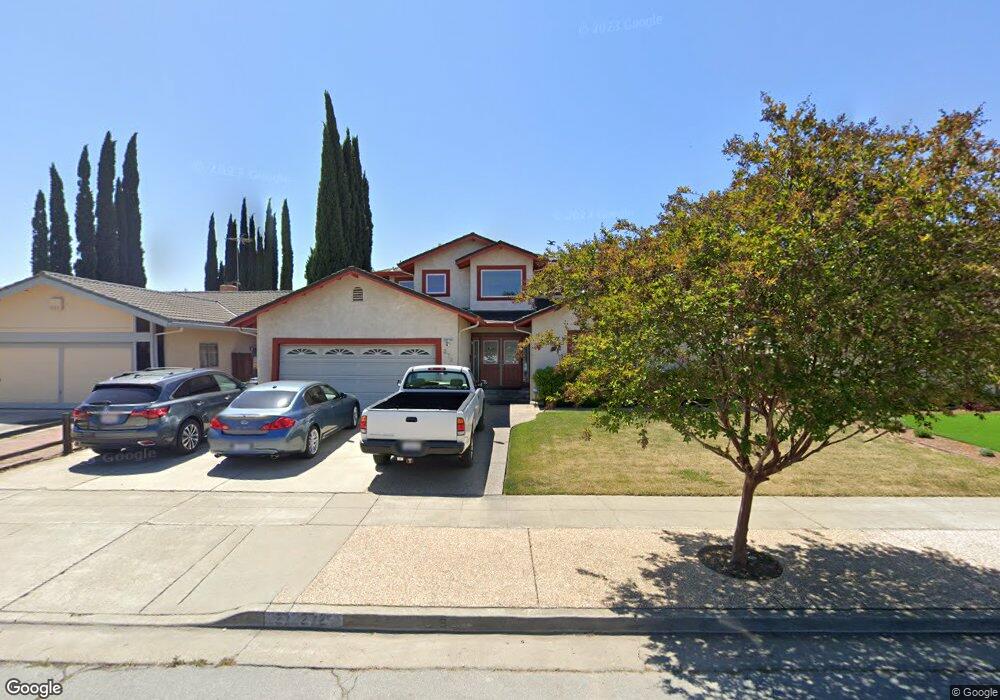
272 El Portal Way San Jose, CA 95119
Rancho Santa Teresa NeighborhoodEstimated Value: $1,660,000 - $1,844,000
5
Beds
4
Baths
1,723
Sq Ft
$1,020/Sq Ft
Est. Value
About This Home
This home is located at 272 El Portal Way, San Jose, CA 95119 and is currently estimated at $1,757,346, approximately $1,019 per square foot. 272 El Portal Way is a home located in Santa Clara County with nearby schools including Santa Teresa Elementary School, Bernal Intermediate School, and Santa Teresa High School.
Ownership History
Date
Name
Owned For
Owner Type
Purchase Details
Closed on
Feb 7, 2020
Sold by
Wong Edwin C and Wong Lorra L
Bought by
Wong Edwin Chung Wan and Wong Lorra Lee
Current Estimated Value
Purchase Details
Closed on
Jan 11, 2002
Sold by
Wong Edwin C and Wong Lorra
Bought by
Wong Edwin C and Wong Lorra L
Home Financials for this Owner
Home Financials are based on the most recent Mortgage that was taken out on this home.
Original Mortgage
$392,000
Outstanding Balance
$154,567
Interest Rate
6.84%
Estimated Equity
$1,602,779
Purchase Details
Closed on
Aug 29, 1995
Sold by
Mullenbach Ron and Mullenbach Marie
Bought by
Wong Edwin C and Wong Lorra
Home Financials for this Owner
Home Financials are based on the most recent Mortgage that was taken out on this home.
Original Mortgage
$213,700
Interest Rate
7.5%
Create a Home Valuation Report for This Property
The Home Valuation Report is an in-depth analysis detailing your home's value as well as a comparison with similar homes in the area
Home Values in the Area
Average Home Value in this Area
Purchase History
| Date | Buyer | Sale Price | Title Company |
|---|---|---|---|
| Wong Edwin Chung Wan | -- | None Available | |
| Wong Edwin C | -- | Chicago Title Co | |
| Wong Edwin C | $225,000 | Old Republic Title Company |
Source: Public Records
Mortgage History
| Date | Status | Borrower | Loan Amount |
|---|---|---|---|
| Open | Wong Edwin C | $392,000 | |
| Closed | Wong Edwin C | $213,700 |
Source: Public Records
Tax History Compared to Growth
Tax History
| Year | Tax Paid | Tax Assessment Tax Assessment Total Assessment is a certain percentage of the fair market value that is determined by local assessors to be the total taxable value of land and additions on the property. | Land | Improvement |
|---|---|---|---|---|
| 2025 | $8,380 | $556,276 | $149,333 | $406,943 |
| 2024 | $8,179 | $545,369 | $146,405 | $398,964 |
| 2023 | $8,034 | $534,677 | $143,535 | $391,142 |
| 2022 | $7,982 | $524,194 | $140,721 | $383,473 |
| 2021 | $7,840 | $513,916 | $137,962 | $375,954 |
| 2020 | $7,650 | $508,648 | $136,548 | $372,100 |
| 2019 | $7,462 | $498,675 | $133,871 | $364,804 |
| 2018 | $7,468 | $488,898 | $131,247 | $357,651 |
| 2017 | $7,364 | $479,313 | $128,674 | $350,639 |
| 2016 | $7,007 | $469,915 | $126,151 | $343,764 |
| 2015 | $6,847 | $462,858 | $124,257 | $338,601 |
| 2014 | $6,189 | $520,882 | $121,823 | $399,059 |
Source: Public Records
Map
Nearby Homes
- 272 Los Palmos Way
- 318 El Molino Way
- 230 Castillon Way
- 6468 Du Sault Dr
- 6571 Catamaran St
- 6121 Lambeck Ln Unit 972
- 377 Brookmere Dr
- 6624 Catamaran St
- 5951 Sunstone Dr Unit 315
- 5925 Charlotte Dr Unit 334
- 5925 Charlotte Dr Unit 212
- 5925 Charlotte Dr Unit 408
- 5886 Smoky Quartz Loop
- 6761 San Anselmo Way
- 5740 Vibrant Loop
- 6273 Mountford Dr
- 5968 Virtual Ct
- 6694 Optimum Loop
- 6710 Optimum Loop
- 5693 Makati Cir Unit D
- 274 El Portal Way
- 270 El Portal Way
- 283 Cresta Vista Way
- 281 Cresta Vista Way
- 278 El Portal Way
- 268 El Portal Way
- 285 Cresta Vista Way
- 279 Cresta Vista Way
- 273 El Portal Way
- 271 El Portal Way
- 287 Cresta Vista Way
- 275 El Portal Way
- 280 El Portal Way
- 269 El Portal Way
- 277 El Portal Way
- 277 Cresta Vista Way
- 289 Cresta Vista Way
- 267 El Portal Way
- 279 El Portal Way
- 282 El Portal Way