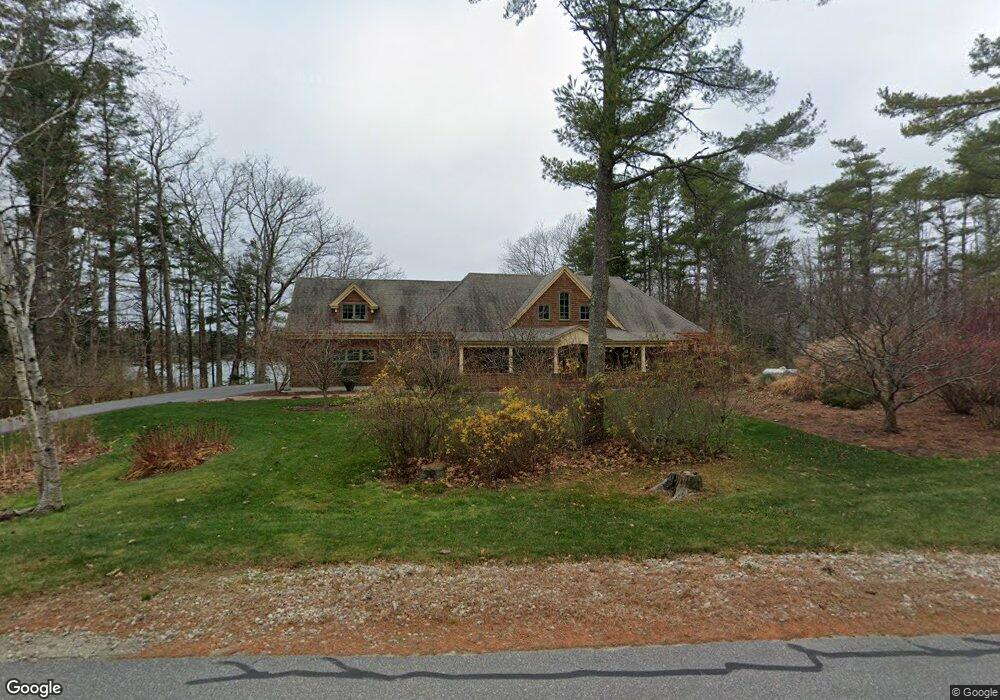
272 Lower Flying Point Rd Freeport, ME 04032
Estimated Value: $1,435,000 - $2,425,051
2
Beds
3
Baths
3,635
Sq Ft
$549/Sq Ft
Est. Value
About This Home
This home is located at 272 Lower Flying Point Rd, Freeport, ME 04032 and is currently estimated at $1,995,263, approximately $548 per square foot. 272 Lower Flying Point Rd is a home located in Cumberland County with nearby schools including Morse Street School, Mast Landing School, and Freeport Middle School.
Ownership History
Date
Name
Owned For
Owner Type
Purchase Details
Closed on
Jul 24, 2020
Sold by
Wood Judy L
Bought by
Wood Judy L and Sanders Douglas E
Current Estimated Value
Home Financials for this Owner
Home Financials are based on the most recent Mortgage that was taken out on this home.
Original Mortgage
$614,250
Interest Rate
3.2%
Mortgage Type
New Conventional
Create a Home Valuation Report for This Property
The Home Valuation Report is an in-depth analysis detailing your home's value as well as a comparison with similar homes in the area
Home Values in the Area
Average Home Value in this Area
Purchase History
| Date | Buyer | Sale Price | Title Company |
|---|---|---|---|
| Wood Judy L | -- | None Available | |
| Wood Judy L | -- | None Available |
Source: Public Records
Mortgage History
| Date | Status | Borrower | Loan Amount |
|---|---|---|---|
| Closed | Wood Judy L | $614,250 |
Source: Public Records
Tax History
| Year | Tax Paid | Tax Assessment Tax Assessment Total Assessment is a certain percentage of the fair market value that is determined by local assessors to be the total taxable value of land and additions on the property. | Land | Improvement |
|---|---|---|---|---|
| 2025 | $18,752 | $1,353,900 | $474,000 | $879,900 |
| 2024 | $17,773 | $1,331,300 | $451,400 | $879,900 |
| 2023 | $16,184 | $1,177,000 | $411,300 | $765,700 |
| 2022 | $15,837 | $1,160,200 | $367,200 | $793,000 |
| 2021 | $15,479 | $1,159,500 | $366,400 | $793,100 |
| 2020 | $14,318 | $1,022,700 | $294,000 | $728,700 |
| 2019 | $13,739 | $960,800 | $277,400 | $683,400 |
| 2018 | $13,053 | $867,300 | $245,800 | $621,500 |
| 2017 | $12,470 | $834,100 | $241,000 | $593,100 |
| 2016 | $12,207 | $772,600 | $225,700 | $546,900 |
| 2015 | $11,995 | $714,000 | $195,300 | $518,700 |
| 2014 | $10,370 | $656,300 | $195,300 | $461,000 |
| 2013 | $10,356 | $653,400 | $195,300 | $458,100 |
Source: Public Records
Map
Nearby Homes
- 58 Maquoit Dr
- 83 Central Ave
- 34 Newfield Rd
- 46 Blackstone Club Rd
- 26 Harvest Ridge Rd Unit 24
- 20 Harvest Ridge Rd Unit 23
- 15 Linwood Rd Unit 15
- 5 Holbrook St
- 11 Orchard Hill Rd
- 7 Shearwater Way
- 67 Farmview Ln
- Map 80 Lot 18-0 White Island
- 212 Main St
- 39 Hunter Rd
- 15 Tinkers Way
- 10 Durham Rd
- 42 Durham Rd
- 1260 Us Route 1
- 1 Mallard Pond Rd
- Lot 2B Allen Point Rd
- 272 Lower Flying Point Rd
- 272 Lower Flying Point Rd
- 0 Shore Dr
- 0 Lower Flying Point Rd
- 11 Shore Dr
- 284 Lower Flying Point Rd
- E21B Bustins Island West Shore Rd
- 11 Shore Dr
- 260 Lower Flying Point Rd
- 15 Shore Dr
- 14 Shore Dr
- 6 Byram Ave
- 292 Lower Flying Point Rd
- 22 Byram Ave
- 25 Shore Dr
- 291 Lower Flying Point Rd
- 291 Lower Flying Point Rd
- 7 Byram Ave
- 252 Lower Flying Point Rd
- 22 Shore Dr
Your Personal Tour Guide
Ask me questions while you tour the home.