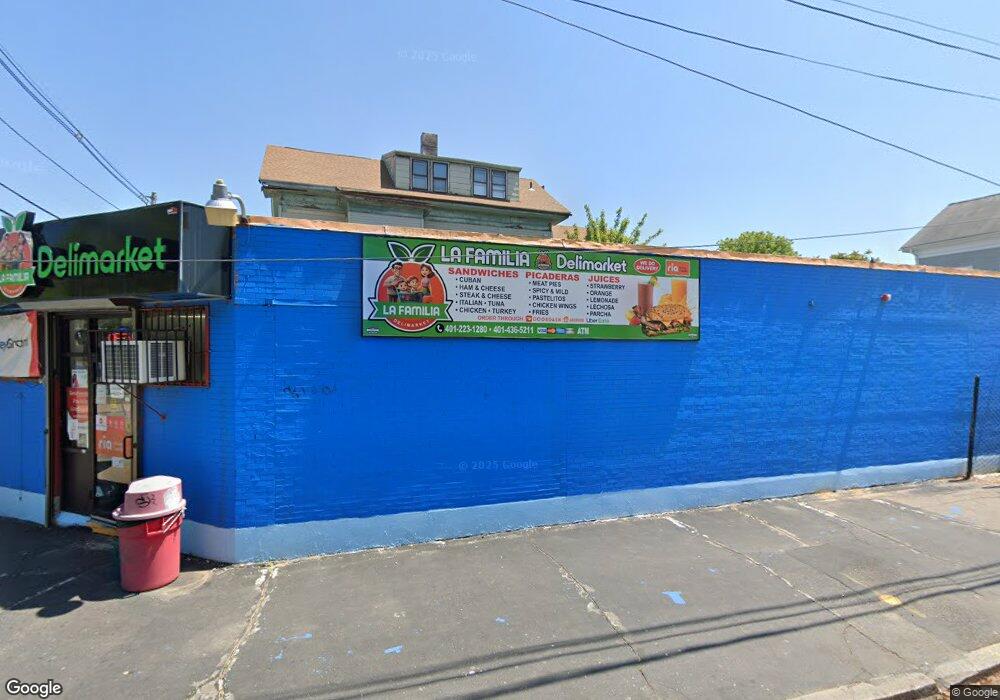
272 Public St Providence, RI 02905
Lower South Providence NeighborhoodEstimated Value: $606,191
--
Bed
--
Bath
1,770
Sq Ft
$342/Sq Ft
Est. Value
About This Home
This home is located at 272 Public St, Providence, RI 02905 and is currently priced at $606,191, approximately $342 per square foot. 272 Public St is a home located in Providence County with nearby schools including Asa Messer Elementary School, Charles N. Fortes Elementary School, and Robert L. Bailey IV Elementary.
Ownership History
Date
Name
Owned For
Owner Type
Purchase Details
Closed on
Dec 28, 2023
Sold by
V & J Deli Grocery Inc
Bought by
Swallon Property Mgmt Llc
Current Estimated Value
Home Financials for this Owner
Home Financials are based on the most recent Mortgage that was taken out on this home.
Original Mortgage
$425,000
Outstanding Balance
$417,501
Interest Rate
7.44%
Mortgage Type
Purchase Money Mortgage
Purchase Details
Closed on
Feb 15, 2017
Sold by
Albizu Fernando and Albizu Nancy
Bought by
V & J Deli Grocery Inc
Home Financials for this Owner
Home Financials are based on the most recent Mortgage that was taken out on this home.
Original Mortgage
$117,000
Interest Rate
4.2%
Mortgage Type
Credit Line Revolving
Create a Home Valuation Report for This Property
The Home Valuation Report is an in-depth analysis detailing your home's value as well as a comparison with similar homes in the area
Home Values in the Area
Average Home Value in this Area
Purchase History
| Date | Buyer | Sale Price | Title Company |
|---|---|---|---|
| Swallon Property Mgmt Llc | $500,000 | None Available | |
| V & J Deli Grocery Inc | -- | -- |
Source: Public Records
Mortgage History
| Date | Status | Borrower | Loan Amount |
|---|---|---|---|
| Open | Swallon Property Mgmt Llc | $425,000 | |
| Previous Owner | V & J Deli Grocery Inc | $117,000 |
Source: Public Records
Tax History Compared to Growth
Tax History
| Year | Tax Paid | Tax Assessment Tax Assessment Total Assessment is a certain percentage of the fair market value that is determined by local assessors to be the total taxable value of land and additions on the property. | Land | Improvement |
|---|---|---|---|---|
| 2025 | $9,271 | $317,500 | $164,400 | $153,100 |
| 2024 | $6,357 | $181,100 | $68,500 | $112,600 |
| 2023 | $6,357 | $181,100 | $68,500 | $112,600 |
| 2022 | $6,411 | $181,100 | $68,500 | $112,600 |
| 2021 | $5,171 | $140,900 | $51,800 | $89,100 |
| 2020 | $5,171 | $140,900 | $51,800 | $89,100 |
| 2019 | $5,171 | $140,900 | $51,800 | $89,100 |
| 2018 | $5,373 | $146,400 | $51,800 | $94,600 |
| 2017 | $5,373 | $146,400 | $51,800 | $94,600 |
| 2016 | $5,373 | $146,400 | $51,800 | $94,600 |
| 2015 | $4,869 | $132,500 | $49,300 | $83,200 |
| 2014 | $4,869 | $132,500 | $49,300 | $83,200 |
| 2013 | $4,869 | $132,500 | $49,300 | $83,200 |
Source: Public Records
Map
Nearby Homes