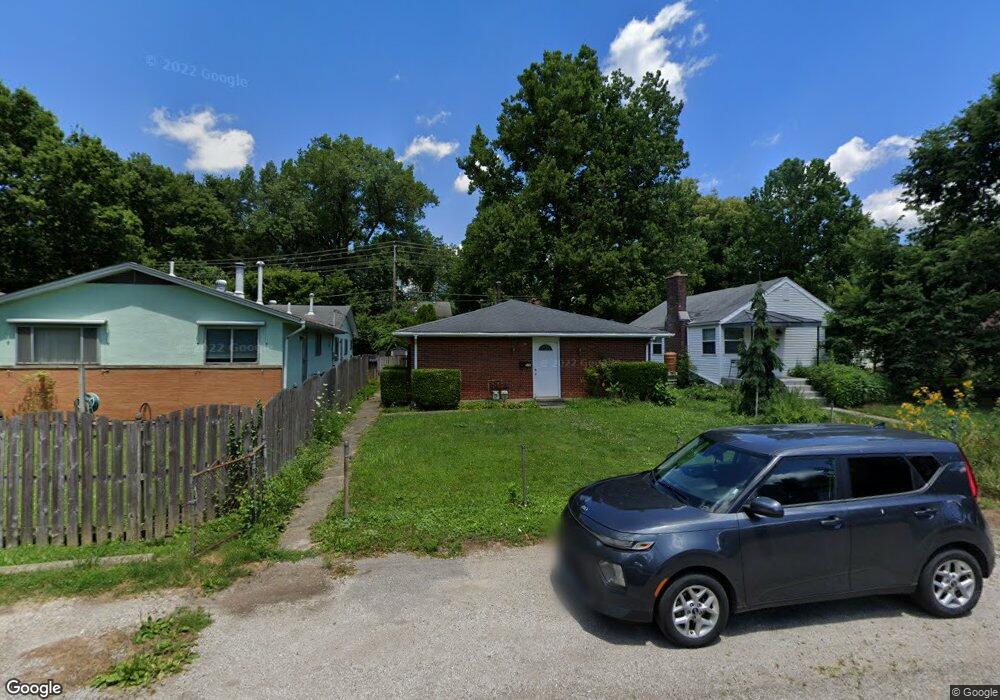
272 W Pacemont Rd Unit 274 Columbus, OH 43202
Clintonville NeighborhoodEstimated Value: $333,000 - $462,000
4
Beds
2
Baths
1,624
Sq Ft
$236/Sq Ft
Est. Value
About This Home
This home is located at 272 W Pacemont Rd Unit 274, Columbus, OH 43202 and is currently estimated at $382,487, approximately $235 per square foot. 272 W Pacemont Rd Unit 274 is a home located in Franklin County with nearby schools including Clinton Elementary School, Dominion Middle School, and Whetstone High School.
Ownership History
Date
Name
Owned For
Owner Type
Purchase Details
Closed on
Apr 27, 1999
Sold by
Berning Gregor J and Berning Susan M
Bought by
Anglin Gregory M
Current Estimated Value
Home Financials for this Owner
Home Financials are based on the most recent Mortgage that was taken out on this home.
Original Mortgage
$94,800
Outstanding Balance
$27,473
Interest Rate
8.5%
Estimated Equity
$355,014
Purchase Details
Closed on
Jan 27, 1999
Sold by
Hud
Bought by
Berning Gregor J and Berning Susan M
Home Financials for this Owner
Home Financials are based on the most recent Mortgage that was taken out on this home.
Original Mortgage
$64,050
Interest Rate
6.78%
Purchase Details
Closed on
Mar 18, 1992
Purchase Details
Closed on
Sep 5, 1990
Create a Home Valuation Report for This Property
The Home Valuation Report is an in-depth analysis detailing your home's value as well as a comparison with similar homes in the area
Home Values in the Area
Average Home Value in this Area
Purchase History
| Date | Buyer | Sale Price | Title Company |
|---|---|---|---|
| Anglin Gregory M | $118,500 | Title First Agency Inc | |
| Berning Gregor J | -- | Title First Agency Inc | |
| -- | $85,000 | -- | |
| -- | $76,000 | -- |
Source: Public Records
Mortgage History
| Date | Status | Borrower | Loan Amount |
|---|---|---|---|
| Open | Anglin Gregory M | $94,800 | |
| Previous Owner | Berning Gregor J | $64,050 |
Source: Public Records
Tax History Compared to Growth
Tax History
| Year | Tax Paid | Tax Assessment Tax Assessment Total Assessment is a certain percentage of the fair market value that is determined by local assessors to be the total taxable value of land and additions on the property. | Land | Improvement |
|---|---|---|---|---|
| 2024 | $4,673 | $101,960 | $42,460 | $59,500 |
| 2023 | $4,614 | $101,955 | $42,455 | $59,500 |
| 2022 | $4,046 | $76,130 | $27,440 | $48,690 |
| 2021 | $4,053 | $76,130 | $27,440 | $48,690 |
| 2020 | $4,059 | $76,130 | $27,440 | $48,690 |
| 2019 | $3,641 | $58,560 | $21,110 | $37,450 |
| 2018 | $3,188 | $58,560 | $21,110 | $37,450 |
| 2017 | $3,641 | $58,560 | $21,110 | $37,450 |
| 2016 | $3,010 | $44,310 | $18,970 | $25,340 |
| 2015 | $2,741 | $44,310 | $18,970 | $25,340 |
| 2014 | $2,747 | $44,310 | $18,970 | $25,340 |
| 2013 | $1,327 | $43,400 | $18,060 | $25,340 |
Source: Public Records
Map
Nearby Homes
- 187 W Pacemont Rd Unit 189
- 143 W Pacemont Rd Unit 145
- 117 W Como Ave
- 3066 Dorris Ave Unit 3066
- 222 W North Broadway St
- 44 W Pacemont Rd
- 110 W Tulane Rd
- 36 Brighton Rd
- 15 W California Ave
- 88 W Kenworth Rd
- 35 E Pacemont Rd
- 3021 N High St
- 10 E Weber Rd Unit 205
- 116 Olentangy Point Unit J116
- 667 Riverview Dr
- 63 E Pacemont Rd
- 45 Tibet Rd
- 219 E Como Ave
- 180 Tibet Rd
- 80 Glencoe Rd
- 266 W Pacemont Rd
- 276 W Pacemont Rd Unit 278
- 280 W Pacemont Rd Unit 282
- 3225 Milton Ave
- 265 W Lakeview Ave Unit 267
- 259 W Lakeview Ave Unit 261
- 271 W Lakeview Ave Unit 273
- 263 W Pacemont Rd
- 255 W Lakeview Ave Unit 257
- 269-271 W Pacemont Rd
- 277-279 W Pacemont Rd
- 269 W Pacemont Rd Unit 271
- 261 W Lakeview Ave
- 277 W Pacemont Rd Unit 279
- 273 W Lakeview Ave
- 251 W Lakeview Ave
- 261 W Pacemont Rd Unit 263
- 261-263 W Pacemont Rd
- 257 W Pacemont Rd
- 285 W Pacemont Rd Unit 287