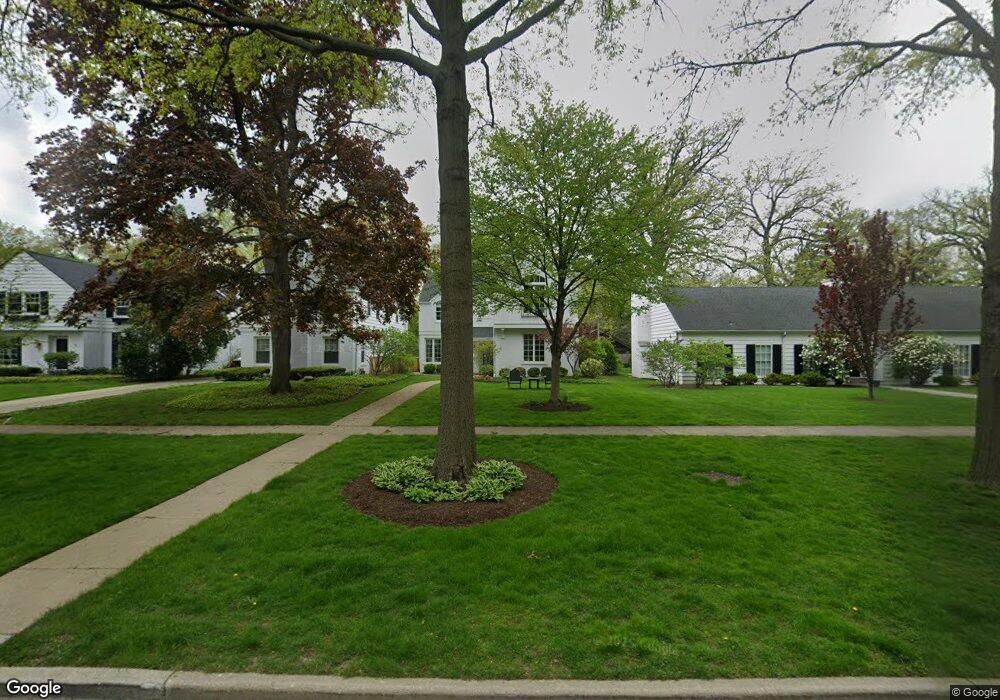
2720 Broadway Ave Evanston, IL 60201
Central Street NeighborhoodEstimated Value: $928,000 - $1,300,000
3
Beds
2
Baths
1,904
Sq Ft
$557/Sq Ft
Est. Value
About This Home
This home is located at 2720 Broadway Ave, Evanston, IL 60201 and is currently estimated at $1,061,027, approximately $557 per square foot. 2720 Broadway Ave is a home located in Cook County with nearby schools including Kingsley Elementary School, Haven Middle School, and Evanston Township High School.
Ownership History
Date
Name
Owned For
Owner Type
Purchase Details
Closed on
Feb 3, 2020
Sold by
Nelson Bridget
Bought by
Nelson Derek and Nelson Bridget
Current Estimated Value
Home Financials for this Owner
Home Financials are based on the most recent Mortgage that was taken out on this home.
Original Mortgage
$608,000
Outstanding Balance
$539,564
Interest Rate
3.72%
Mortgage Type
New Conventional
Estimated Equity
$521,463
Purchase Details
Closed on
May 30, 2014
Sold by
Nelson Derek and Nelson Bridget
Bought by
Nelson Bridget and Bridget Nelson Revocable Trust
Purchase Details
Closed on
Oct 2, 2008
Sold by
Timm Craig Michael and Timm Gayla Keenan
Bought by
Nelson Derek and Nelson Bridget
Home Financials for this Owner
Home Financials are based on the most recent Mortgage that was taken out on this home.
Original Mortgage
$535,500
Interest Rate
5.9%
Mortgage Type
Unknown
Purchase Details
Closed on
Sep 3, 2002
Sold by
Urkov Thorpe Gregory A and Urkov Thorpe Lynn
Bought by
Urkov Thorpe Gregory A and Urkov Thorpe Lynn
Create a Home Valuation Report for This Property
The Home Valuation Report is an in-depth analysis detailing your home's value as well as a comparison with similar homes in the area
Home Values in the Area
Average Home Value in this Area
Purchase History
| Date | Buyer | Sale Price | Title Company |
|---|---|---|---|
| Nelson Derek | -- | Proper Title Llc | |
| Nelson Bridget | -- | None Available | |
| Nelson Derek | $630,000 | Prairie Title Inc | |
| Urkov Thorpe Gregory A | -- | -- |
Source: Public Records
Mortgage History
| Date | Status | Borrower | Loan Amount |
|---|---|---|---|
| Open | Nelson Derek | $608,000 | |
| Closed | Nelson Derek | $535,500 |
Source: Public Records
Tax History Compared to Growth
Tax History
| Year | Tax Paid | Tax Assessment Tax Assessment Total Assessment is a certain percentage of the fair market value that is determined by local assessors to be the total taxable value of land and additions on the property. | Land | Improvement |
|---|---|---|---|---|
| 2024 | $16,870 | $73,000 | $18,294 | $54,706 |
| 2023 | $16,162 | $73,000 | $18,294 | $54,706 |
| 2022 | $16,162 | $73,000 | $18,294 | $54,706 |
| 2021 | $11,725 | $47,511 | $11,931 | $35,580 |
| 2020 | $11,628 | $47,511 | $11,931 | $35,580 |
| 2019 | $11,336 | $51,812 | $11,931 | $39,881 |
| 2018 | $12,463 | $48,926 | $9,942 | $38,984 |
| 2017 | $12,154 | $48,926 | $9,942 | $38,984 |
| 2016 | $11,750 | $48,926 | $9,942 | $38,984 |
| 2015 | $9,824 | $39,262 | $8,351 | $30,911 |
| 2014 | $9,745 | $39,262 | $8,351 | $30,911 |
| 2013 | $10,606 | $43,505 | $8,351 | $35,154 |
Source: Public Records
Map
Nearby Homes
- 2635 Poplar Ave
- 2539.5 Prairie Ave Unit 3W
- 2741 Eastwood Ave
- 2135 Central St Unit 3W
- 2108 Harrison St
- 2015 Colfax St
- 2020 Colfax St
- 1915 Grant St
- 1910 Grant St
- 1209 Maple Ave
- 526 Linden Ave
- 1918 Noyes St
- 250 3rd St
- 1241 Maple Ave
- 2720 Central St Unit 4C
- 1303 Maple Ave
- 410 Prairie Ave
- 2726 Central St Unit 3D
- 2730 Central St Unit 3A
- 1025 Central Ave
- 2716 Broadway Ave
- 2730 Broadway Ave
- 2730 Broadway Ave
- 2712 Broadway Ave
- 2708 Broadway Ave
- 1904 Jenks St
- 2704 Broadway Ave
- 2717 Woodbine Ave
- 2721 Woodbine Ave
- 2715 Woodbine Ave
- 2736 Broadway Ave
- 2700 Broadway Ave
- 2711 Woodbine Ave
- 1903 Livingston St
- 2727 Woodbine Ave
- 2740 Broadway Ave
- 2705 Woodbine Ave
- 1905 Jenks St
- 2719 Broadway Ave
- 2725 Broadway Ave