2720 Drexel St Omaha, NE 68107
South Central Omaha NeighborhoodEstimated Value: $158,000 - $187,000
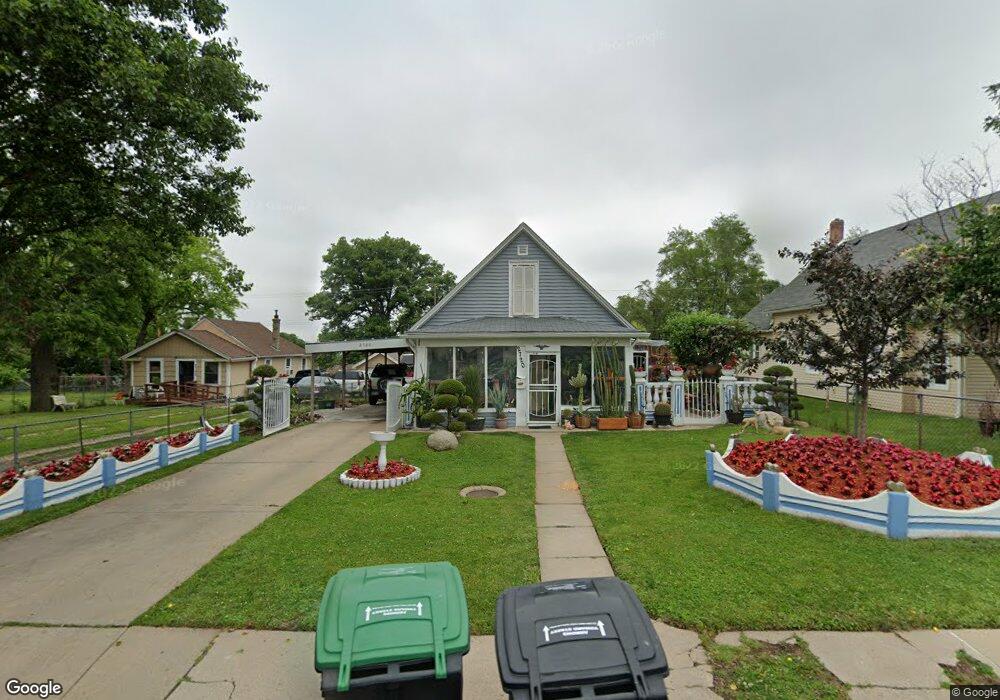
About This Home
This home is located at 2720 Drexel St, Omaha, NE 68107 and is currently estimated at $171,251, approximately $184 per square foot. 2720 Drexel St is a home located in Douglas County with nearby schools including Highland Elementary School, Bryan Middle School, and Bryan High School.
Ownership History
We collect this data history from publicly available records. To have your information removed, we recommend requesting removal directly through your county’s website.
Purchase Details
Home Financials for this Owner
Home Financials are based on the most recent Mortgage that was taken out on this home.Home Values in the Area
Average Home Value in this Area
Purchase History
We collect this data history from publicly available records. To have your information removed, we recommend requesting removal directly through your county’s website.
| Date | Buyer | Sale Price | Title Company |
|---|---|---|---|
| $51,000 | -- |
Mortgage History
We collect this data history from publicly available records. To have your information removed, we recommend requesting removal directly through your county’s website.
| Date | Status | Borrower | Loan Amount |
|---|---|---|---|
| Open | $50,050 |
Tax History
We collect this data history from publicly available records. To have your information removed, we recommend requesting removal directly through your county’s website.
| Year | Tax Paid | Tax Assessment Tax Assessment Total Assessment is a certain percentage of the fair market value that is determined by local assessors to be the total taxable value of land and additions on the property. | Land | Improvement |
|---|---|---|---|---|
| 2025 | $2,477 | $144,600 | $10,400 | $134,200 |
| 2024 | $2,063 | $144,600 | $10,400 | $134,200 |
| 2023 | $2,063 | $97,800 | $10,400 | $87,400 |
| 2022 | $2,045 | $95,800 | $8,400 | $87,400 |
| 2021 | $2,028 | $95,800 | $8,400 | $87,400 |
| 2020 | $1,139 | $53,200 | $12,500 | $40,700 |
| 2019 | $1,142 | $53,200 | $12,500 | $40,700 |
| 2018 | $1,785 | $83,000 | $12,500 | $70,500 |
| 2017 | $1,562 | $72,300 | $4,900 | $67,400 |
| 2016 | $1,551 | $72,300 | $4,900 | $67,400 |
| 2015 | $1,531 | $72,300 | $4,900 | $67,400 |
| 2014 | $1,531 | $72,300 | $4,900 | $67,400 |
Map
- 2816 Monroe St
- 6519 S 32nd St
- 6517 Gilmore Ave
- 2314 Emiline St
- 3264 Madison St
- 7416 S 28th St
- 3111 Blue Ridge Dr
- 3338 Harrison St
- 3022 Pleasant Dr
- 2714 Chandler Rd W
- 2612 Chandler Rd W
- 3368 X St
- 2522 Mose Ave Unit 4C
- 2015 W St
- 7538 Chandler Hills Dr
- 3615 Drexel St
- 5425 S 23rd St
- 6254 S 36th Ave
- 7801 S 30th St
- 1614 Drexel St
Ask me questions while you tour the home.