Estimated Value: $760,000 - $1,174,618
4
Beds
4
Baths
2,500
Sq Ft
$395/Sq Ft
Est. Value
About This Home
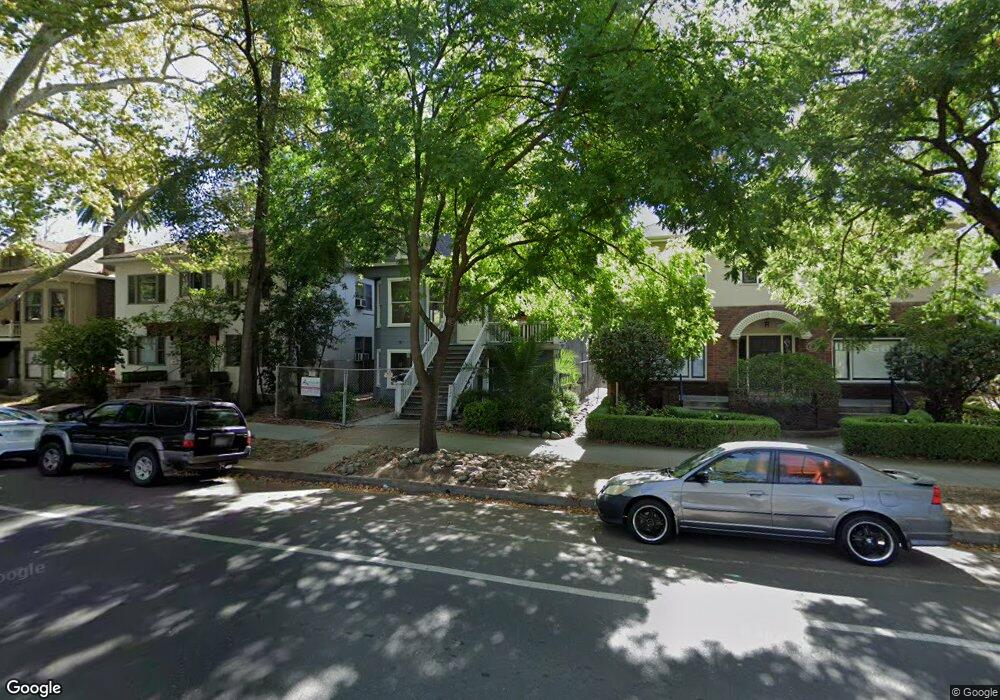
This home is located at 2720 H St, Sacramento, CA 95816 and is currently estimated at $987,155, approximately $394 per square foot. 2720 H St is a home located in Sacramento County with nearby schools including Theodore Judah Elementary, Miwok Middle School, and C. K. McClatchy High.
Ownership History
Date
Name
Owned For
Owner Type
Purchase Details
Closed on
Sep 3, 2020
Sold by
Qaqundah James Joseph
Bought by
Qaqundah James and Temple Anne Louise
Current Estimated Value
Purchase Details
Closed on
Oct 19, 2010
Sold by
Miller John C and Miller Sonya M
Bought by
Qaqundah James Joseph
Home Financials for this Owner
Home Financials are based on the most recent Mortgage that was taken out on this home.
Original Mortgage
$307,500
Outstanding Balance
$202,504
Interest Rate
4.31%
Mortgage Type
New Conventional
Estimated Equity
$784,651
Purchase Details
Closed on
Mar 31, 2005
Sold by
Stevens L Lorraine and Ehrich Herman George
Bought by
Miller John C and Miller Sonya M
Home Financials for this Owner
Home Financials are based on the most recent Mortgage that was taken out on this home.
Original Mortgage
$397,500
Interest Rate
6.12%
Mortgage Type
Purchase Money Mortgage
Purchase Details
Closed on
May 21, 1997
Sold by
Ehrich Lola T
Bought by
Stevens Lola Lorraine and Ehrich Herman George
Create a Home Valuation Report for This Property
The Home Valuation Report is an in-depth analysis detailing your home's value as well as a comparison with similar homes in the area
Home Values in the Area
Average Home Value in this Area
Purchase History
| Date | Buyer | Sale Price | Title Company |
|---|---|---|---|
| Qaqundah James | -- | None Available | |
| Qaqundah James Joseph | $410,000 | Placer Title Company | |
| Miller John C | $530,000 | Stewart Title Of Sacramento | |
| Stevens L Lorraine | -- | Stewart Title Of Sacramento | |
| Stevens Lola Lorraine | -- | -- |
Source: Public Records
Mortgage History
| Date | Status | Borrower | Loan Amount |
|---|---|---|---|
| Open | Qaqundah James Joseph | $307,500 | |
| Previous Owner | Stevens L Lorraine | $397,500 |
Source: Public Records
Tax History Compared to Growth
Tax History
| Year | Tax Paid | Tax Assessment Tax Assessment Total Assessment is a certain percentage of the fair market value that is determined by local assessors to be the total taxable value of land and additions on the property. | Land | Improvement |
|---|---|---|---|---|
| 2025 | $6,638 | $525,267 | $231,886 | $293,381 |
| 2024 | $6,638 | $514,969 | $227,340 | $287,629 |
| 2023 | $6,482 | $504,873 | $222,883 | $281,990 |
| 2022 | $6,371 | $494,974 | $218,513 | $276,461 |
| 2021 | $6,079 | $485,270 | $214,229 | $271,041 |
| 2020 | $6,118 | $480,295 | $212,033 | $268,262 |
| 2019 | $5,992 | $470,878 | $207,876 | $263,002 |
| 2018 | $5,837 | $461,646 | $203,800 | $257,846 |
| 2017 | $5,756 | $452,595 | $199,804 | $252,791 |
| 2016 | $5,594 | $443,722 | $195,887 | $247,835 |
| 2015 | $5,511 | $437,058 | $192,945 | $244,113 |
| 2014 | $5,370 | $428,498 | $189,166 | $239,332 |
Source: Public Records
Map
Nearby Homes