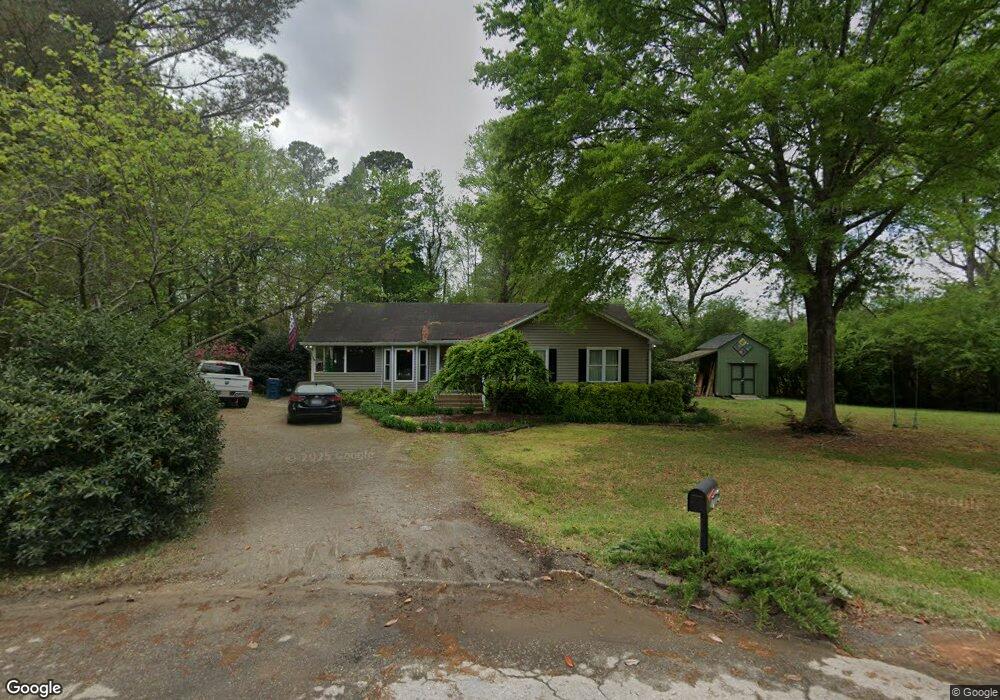
2720 Quail Point Dr Raleigh, NC 27603
Estimated Value: $333,000 - $342,000
3
Beds
2
Baths
1,364
Sq Ft
$248/Sq Ft
Est. Value
About This Home
This home is located at 2720 Quail Point Dr, Raleigh, NC 27603 and is currently estimated at $338,473, approximately $248 per square foot. 2720 Quail Point Dr is a home located in Wake County with nearby schools including Vance Elementary School, North Garner Middle, and Garner High.
Ownership History
Date
Name
Owned For
Owner Type
Purchase Details
Closed on
Dec 18, 2019
Sold by
Aaron Richard L
Bought by
Rivero Michelle M
Current Estimated Value
Home Financials for this Owner
Home Financials are based on the most recent Mortgage that was taken out on this home.
Original Mortgage
$152,625
Outstanding Balance
$135,899
Interest Rate
4.12%
Mortgage Type
FHA
Estimated Equity
$202,574
Purchase Details
Closed on
Dec 15, 2009
Sold by
Deering John
Bought by
Rivero Michelle M and Aaron Richard L
Home Financials for this Owner
Home Financials are based on the most recent Mortgage that was taken out on this home.
Original Mortgage
$139,329
Interest Rate
5.01%
Mortgage Type
FHA
Purchase Details
Closed on
Oct 3, 2005
Sold by
Checkan Richard J and Checkan Bonnie E
Bought by
Deering John
Home Financials for this Owner
Home Financials are based on the most recent Mortgage that was taken out on this home.
Original Mortgage
$79,000
Interest Rate
5.77%
Mortgage Type
Fannie Mae Freddie Mac
Create a Home Valuation Report for This Property
The Home Valuation Report is an in-depth analysis detailing your home's value as well as a comparison with similar homes in the area
Home Values in the Area
Average Home Value in this Area
Purchase History
| Date | Buyer | Sale Price | Title Company |
|---|---|---|---|
| Rivero Michelle M | -- | None Available | |
| Rivero Michelle M | -- | None Listed On Document | |
| Rivero Michelle M | $142,000 | Statewide Title Inc | |
| Deering John | $132,000 | None Available |
Source: Public Records
Mortgage History
| Date | Status | Borrower | Loan Amount |
|---|---|---|---|
| Open | Rivero Michelle M | $152,625 | |
| Closed | Rivero Michelle M | $152,625 | |
| Previous Owner | Rivero Michelle M | $139,329 | |
| Previous Owner | Deering John | $79,000 |
Source: Public Records
Tax History Compared to Growth
Tax History
| Year | Tax Paid | Tax Assessment Tax Assessment Total Assessment is a certain percentage of the fair market value that is determined by local assessors to be the total taxable value of land and additions on the property. | Land | Improvement |
|---|---|---|---|---|
| 2025 | $1,929 | $298,490 | $120,000 | $178,490 |
| 2024 | $1,874 | $298,490 | $120,000 | $178,490 |
| 2023 | $1,503 | $190,191 | $50,000 | $140,191 |
| 2022 | $1,394 | $190,191 | $50,000 | $140,191 |
| 2021 | $1,356 | $190,191 | $50,000 | $140,191 |
| 2020 | $1,331 | $189,751 | $50,000 | $139,751 |
| 2019 | $1,146 | $137,814 | $40,000 | $97,814 |
| 2018 | $1,054 | $137,814 | $40,000 | $97,814 |
| 2017 | $1,000 | $137,814 | $40,000 | $97,814 |
| 2016 | $980 | $137,814 | $40,000 | $97,814 |
| 2015 | $928 | $130,792 | $34,000 | $96,792 |
| 2014 | $881 | $130,792 | $34,000 | $96,792 |
Source: Public Records
Map
Nearby Homes
- 2712 Quail Point Dr
- 2817 Buckboard Ln
- 2400 Trueway Ln
- 5232 Passenger Place
- 2704 Stageline Dr
- 5512 Glenhurst Dr N
- 1100 Broadhaven Dr
- 5712 Turner Store Ln
- 10329 Fanny Brown Rd
- 2600 Banks Rd Unit Lot 2
- 2600 Banks Rd Unit Lot 1
- 1005 Turner Meadow Dr
- 1200 Misty Morning Way
- 1320 Taylor Farm Rd
- 1420 Taylor Farm Rd
- 936 Elbridge Dr
- 5817 Shedd Dr
- 449 Kings Hollow Dr
- 10917 Stage Dr
- 3205 Banks Rd
- 2721 Quail Point Dr
- 5305 Horse Buggy Dr
- 2724 Quail Point Dr
- 2725 Quail Point Dr
- 2716 Quail Point Dr
- 2717 Quail Point Dr
- 2800 Buckboard Ln
- 2801 Buckboard Ln
- 2805 Livery Way
- 5308 Horse Buggy Dr
- 10501 Old Stage Rd
- 2709 Quail Point Dr
- 2808 Buckboard Ln
- 5301 Horse Buggy Dr
- 2801 Livery Way
- 2805 Buckboard Ln
- 10512 Old Stage Rd
- 10409 Old Stage Rd
- 2821 Livery Way
- 2809 Buckboard Ln