Estimated Value: $356,704 - $405,000
3
Beds
2
Baths
1,320
Sq Ft
$294/Sq Ft
Est. Value
About This Home
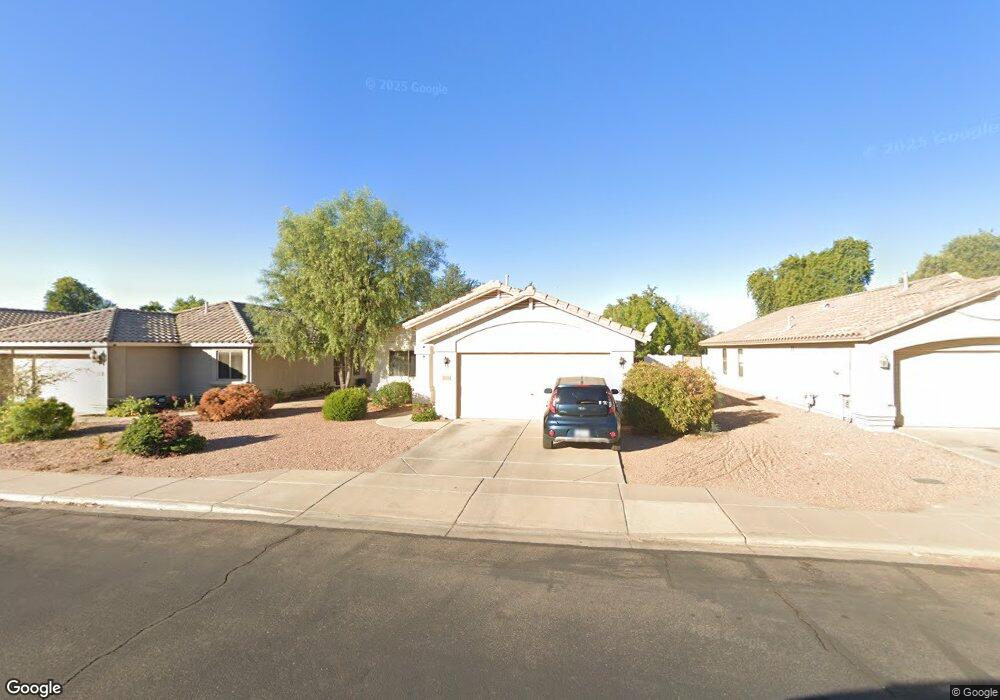
This home is located at 2720 S Keene, Mesa, AZ 85209 and is currently estimated at $388,426, approximately $294 per square foot. 2720 S Keene is a home located in Maricopa County with nearby schools including Augusta Ranch Elementary School, Desert Ridge Jr. High School, and Desert Ridge High School.
Ownership History
Date
Name
Owned For
Owner Type
Purchase Details
Closed on
Aug 15, 2006
Sold by
Goggin James D and Goggin Rebecca S
Bought by
Rezac Don and Rezac Sharon
Current Estimated Value
Home Financials for this Owner
Home Financials are based on the most recent Mortgage that was taken out on this home.
Original Mortgage
$230,000
Outstanding Balance
$137,638
Interest Rate
6.7%
Mortgage Type
Seller Take Back
Estimated Equity
$250,788
Purchase Details
Closed on
May 27, 2004
Sold by
Badger Matthew S and Badger Andrea D
Bought by
Goggin James D and Goggin Rebecca S
Purchase Details
Closed on
Oct 11, 2000
Sold by
U S Home Corp
Bought by
Badger Matthew S and Badger Andrea D
Home Financials for this Owner
Home Financials are based on the most recent Mortgage that was taken out on this home.
Original Mortgage
$121,998
Interest Rate
7.9%
Mortgage Type
FHA
Create a Home Valuation Report for This Property
The Home Valuation Report is an in-depth analysis detailing your home's value as well as a comparison with similar homes in the area
Home Values in the Area
Average Home Value in this Area
Purchase History
| Date | Buyer | Sale Price | Title Company |
|---|---|---|---|
| Rezac Don | $230,000 | Security Title Agency Inc | |
| Goggin James D | $140,000 | Chicago Title Insurance Co | |
| Badger Matthew S | $123,282 | Stewart Title & Trust |
Source: Public Records
Mortgage History
| Date | Status | Borrower | Loan Amount |
|---|---|---|---|
| Open | Rezac Don | $230,000 | |
| Previous Owner | Badger Matthew S | $121,998 |
Source: Public Records
Tax History Compared to Growth
Tax History
| Year | Tax Paid | Tax Assessment Tax Assessment Total Assessment is a certain percentage of the fair market value that is determined by local assessors to be the total taxable value of land and additions on the property. | Land | Improvement |
|---|---|---|---|---|
| 2025 | $1,485 | $16,556 | -- | -- |
| 2024 | $1,438 | $15,768 | -- | -- |
| 2023 | $1,438 | $28,950 | $5,790 | $23,160 |
| 2022 | $1,406 | $21,970 | $4,390 | $17,580 |
| 2021 | $1,485 | $20,580 | $4,110 | $16,470 |
| 2020 | $1,460 | $18,710 | $3,740 | $14,970 |
| 2019 | $1,366 | $16,930 | $3,380 | $13,550 |
| 2018 | $1,308 | $15,530 | $3,100 | $12,430 |
| 2017 | $1,270 | $14,270 | $2,850 | $11,420 |
| 2016 | $1,304 | $13,710 | $2,740 | $10,970 |
| 2015 | $1,196 | $13,300 | $2,660 | $10,640 |
Source: Public Records
Map
Nearby Homes
- 9513 E Olla Cir
- 9434 E Osage Ave
- 9637 E Olla Ave
- 9328 E Osage Ave
- 9233 E Neville Ave Unit 1011
- 9233 E Neville Ave Unit 1103
- 2642 S Joplin
- 9721 E Osage Ave Unit 3
- 9316 E Monterey Ave
- 9566 E Plana Ave Unit II
- 9326 E Pampa Ave
- 2965 S Sierra Heights Unit 216
- 9744 E Pantera Ave
- 9302 E Plana Ave
- 9426 E Los Lagos Vista Ave
- 2821 S Skyline Unit 107
- 2821 S Skyline Unit 176
- 2821 S Skyline Unit 141
- 2821 S Skyline Unit 135
- 2550 South S Ellsworth Rd Unit 207