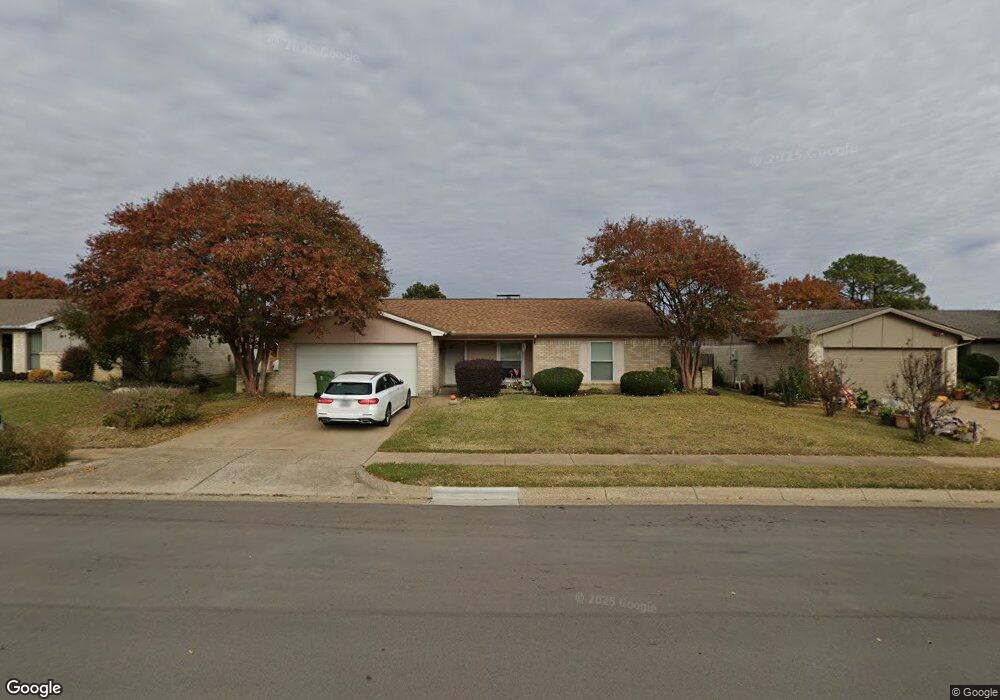
2721 Cummings Dr Bedford, TX 76021
Estimated Value: $372,812 - $473,000
3
Beds
2
Baths
1,946
Sq Ft
$217/Sq Ft
Est. Value
About This Home
This home is located at 2721 Cummings Dr, Bedford, TX 76021 and is currently estimated at $422,703, approximately $217 per square foot. 2721 Cummings Dr is a home located in Tarrant County with nearby schools including Spring Garden Elementary School, Harwood Junior High School, and Trinity High School.
Ownership History
Date
Name
Owned For
Owner Type
Purchase Details
Closed on
Sep 6, 2001
Sold by
Shirk Linda A Levens and Shirk Steven M
Bought by
Smalley Jeffrey G and Smalley Julie L
Current Estimated Value
Home Financials for this Owner
Home Financials are based on the most recent Mortgage that was taken out on this home.
Original Mortgage
$124,218
Outstanding Balance
$47,509
Interest Rate
6.88%
Mortgage Type
FHA
Estimated Equity
$375,194
Purchase Details
Closed on
Oct 7, 1997
Sold by
Malone Dana and Malone Richard K
Bought by
Levens Linda A
Home Financials for this Owner
Home Financials are based on the most recent Mortgage that was taken out on this home.
Original Mortgage
$71,200
Interest Rate
7.52%
Purchase Details
Closed on
Jun 3, 1997
Sold by
Blevins Steven W
Bought by
Commercial Federal Mtg Corp
Create a Home Valuation Report for This Property
The Home Valuation Report is an in-depth analysis detailing your home's value as well as a comparison with similar homes in the area
Home Values in the Area
Average Home Value in this Area
Purchase History
| Date | Buyer | Sale Price | Title Company |
|---|---|---|---|
| Smalley Jeffrey G | -- | Safeco Land Title | |
| Levens Linda A | -- | Lone Star Title Inc | |
| Commercial Federal Mtg Corp | $58,971 | -- |
Source: Public Records
Mortgage History
| Date | Status | Borrower | Loan Amount |
|---|---|---|---|
| Open | Smalley Jeffrey G | $124,218 | |
| Previous Owner | Levens Linda A | $71,200 |
Source: Public Records
Tax History Compared to Growth
Tax History
| Year | Tax Paid | Tax Assessment Tax Assessment Total Assessment is a certain percentage of the fair market value that is determined by local assessors to be the total taxable value of land and additions on the property. | Land | Improvement |
|---|---|---|---|---|
| 2025 | $5,366 | $322,000 | $70,000 | $252,000 |
| 2024 | $5,366 | $341,119 | $70,000 | $271,119 |
| 2023 | $5,329 | $315,095 | $45,000 | $270,095 |
| 2022 | $5,517 | $252,600 | $45,000 | $207,600 |
| 2021 | $5,765 | $246,505 | $45,000 | $201,505 |
| 2020 | $5,290 | $222,493 | $45,000 | $177,493 |
| 2019 | $5,293 | $230,601 | $45,000 | $185,601 |
| 2018 | $4,430 | $198,057 | $45,000 | $153,057 |
| 2017 | $4,356 | $189,765 | $30,000 | $159,765 |
| 2016 | $3,960 | $163,684 | $30,000 | $133,684 |
| 2015 | $3,324 | $153,164 | $30,000 | $123,164 |
| 2014 | $3,324 | $143,300 | $18,000 | $125,300 |
Source: Public Records
Map
Nearby Homes
- 3152 Woodbridge Dr
- 3017 Bluebonnet Ln
- 3721 Fieldcrest Ln
- 3405 Scenic Hills Dr
- 2600 Willow Bend
- 3816 Rolling Meadows Dr
- 2609 Talisman Ct
- 3024 Highgate Ln
- 2305 Meadowlark Ln
- 2709 Willow Bend
- 3001 Glenwood Ct
- 3024 Pecan Cir
- 3840 Edgewater Dr
- 2209 Laurel Ct
- 3013 Bent Tree Ln
- Seaberry II Plan at Grace Park - Signature Series
- Primrose FE V Plan at Grace Park - Signature Series
- Hawthorne Plan at Grace Park - Signature Series
- Seaberry Plan at Grace Park - Signature Series
- Gardenia Plan at Grace Park - Signature Series
- 2717 Cummings Dr
- 2729 Cummings Dr
- 2733 Cummings Dr
- 3401 Murphy Dr
- 2709 Cummings Dr
- 3405 Murphy Dr
- 3604 Rolling Meadows Dr
- 2705 Cummings Dr
- 3409 Murphy Dr
- 3608 Rolling Meadows Dr
- 2801 Cummings Dr
- 3413 Murphy Dr
- 2800 Cummings Dr
- 3612 Rolling Meadows Dr
- 2627 Cummings Dr
- 2805 Cummings Dr
- 3300 Murphy Dr
- 2804 Bluebonnet Ln
- 2625 Cummings Dr
- 2801 Bluebonnet Ln