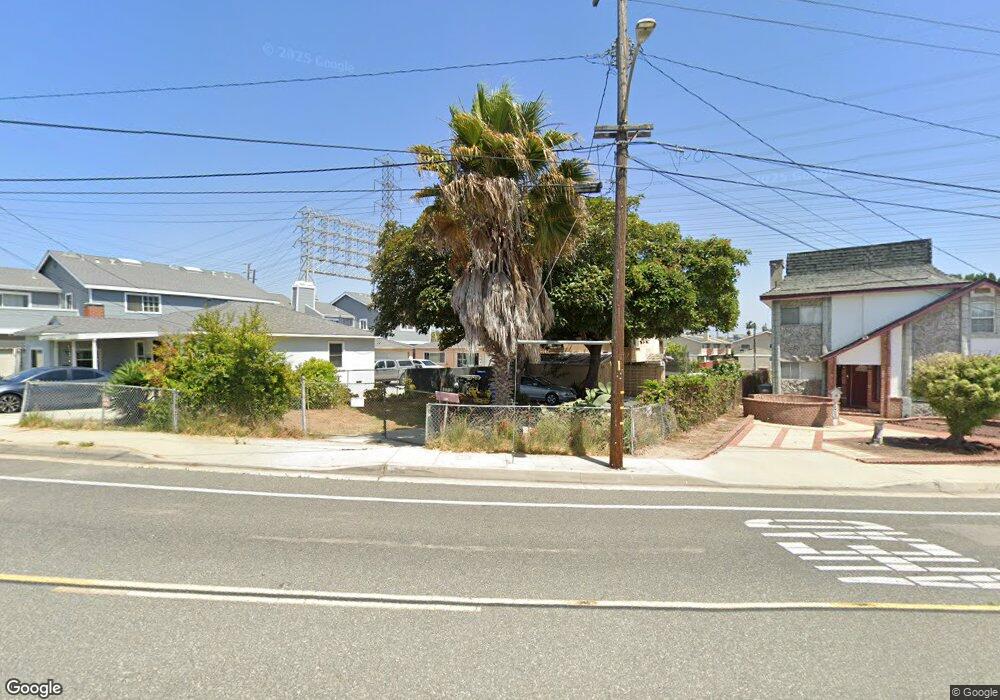
2721 Grant Ave Redondo Beach, CA 90278
North Redondo Beach NeighborhoodEstimated Value: $1,399,876 - $1,760,000
4
Beds
2
Baths
1,831
Sq Ft
$877/Sq Ft
Est. Value
About This Home
This home is located at 2721 Grant Ave, Redondo Beach, CA 90278 and is currently estimated at $1,605,969, approximately $877 per square foot. 2721 Grant Ave is a home located in Los Angeles County with nearby schools including Washington Elementary School, Adams Middle School, and Redondo Union High School.
Ownership History
Date
Name
Owned For
Owner Type
Purchase Details
Closed on
Jan 10, 2012
Sold by
Alvarez Moses G and Alvarez Alma
Bought by
Alvarez Joshua and Alvarez Alma
Current Estimated Value
Purchase Details
Closed on
Sep 25, 2009
Sold by
Alvarez Joshua
Bought by
Alvarez Moses G
Purchase Details
Closed on
Sep 17, 2003
Sold by
Alvarez Joshua and Alvarez Alma
Bought by
Alvarez Joshua and Alvarez Alma
Purchase Details
Closed on
Jun 13, 2002
Sold by
Sweis Teresa and Beard Robert Wayne
Bought by
Alvarez Joshua and Alvarez Alma
Home Financials for this Owner
Home Financials are based on the most recent Mortgage that was taken out on this home.
Original Mortgage
$356,000
Interest Rate
6.74%
Purchase Details
Closed on
Apr 4, 2002
Sold by
Sweis Teresa
Bought by
Sweis Teresa and Beard Robert Wayne
Purchase Details
Closed on
Oct 28, 1993
Sold by
Cook Loretta M
Bought by
Cook Loretta M and Loretta M Cook 1993 Revocable
Create a Home Valuation Report for This Property
The Home Valuation Report is an in-depth analysis detailing your home's value as well as a comparison with similar homes in the area
Home Values in the Area
Average Home Value in this Area
Purchase History
| Date | Buyer | Sale Price | Title Company |
|---|---|---|---|
| Alvarez Joshua | -- | None Available | |
| Alvarez Moses G | -- | None Available | |
| Alvarez Joshua | -- | -- | |
| Alvarez Joshua | $445,000 | First American Title Co | |
| Sweis Teresa | -- | -- | |
| Cook Loretta M | -- | -- |
Source: Public Records
Mortgage History
| Date | Status | Borrower | Loan Amount |
|---|---|---|---|
| Previous Owner | Alvarez Joshua | $356,000 |
Source: Public Records
Tax History Compared to Growth
Tax History
| Year | Tax Paid | Tax Assessment Tax Assessment Total Assessment is a certain percentage of the fair market value that is determined by local assessors to be the total taxable value of land and additions on the property. | Land | Improvement |
|---|---|---|---|---|
| 2025 | $10,246 | $761,101 | $554,127 | $206,974 |
| 2024 | $9,817 | $746,178 | $543,262 | $202,916 |
| 2023 | $9,648 | $731,548 | $532,610 | $198,938 |
| 2022 | $9,438 | $717,205 | $522,167 | $195,038 |
| 2021 | $9,166 | $703,143 | $511,929 | $191,214 |
| 2020 | $9,129 | $695,934 | $506,680 | $189,254 |
| 2019 | $8,911 | $682,290 | $496,746 | $185,544 |
| 2018 | $8,562 | $668,912 | $487,006 | $181,906 |
| 2016 | $8,283 | $642,940 | $468,096 | $174,844 |
| 2015 | $8,141 | $633,283 | $461,065 | $172,218 |
| 2014 | $8,024 | $620,879 | $452,034 | $168,845 |
Source: Public Records
Map
Nearby Homes
- 2719 Grant Ave Unit C
- 2706 Grant Ave Unit A
- 2615 Rockefeller Ln
- 2750 Artesia Blvd Unit 341
- 2750 Artesia Blvd Unit 364
- 2607 Grant Ave Unit A
- 2604 Grant Ave Unit A
- 2604 Grant Ave Unit C
- 2604 Grant Ave Unit B
- 2602 Carnegie Ln
- 2617 182nd St
- 2609 Vanderbilt Ln Unit 4
- 2517 Huntington Ln Unit B
- 1300 Firmona Ave
- 17234 Condon Ave
- 2708 183rd St
- 18204 Kingsdale Ave
- 2603 Nelson Ave Unit B
- 2005 Phelan Ln
- 18406 Kingsdale Ave
- 2723 Grant Ave
- 2719 Grant Ave
- 2719 Grant Ave Unit B
- 2719 Grant Ave Unit A
- 2725 Grant Ave
- 2717 Grant Ave Unit 3
- 2717 Grant Ave Unit 2
- 2717 Grant Ave Unit 1
- 2715 Grant Ave Unit B
- 2715 Grant Ave Unit A
- 2715 Grant Ave Unit C
- 2715 Grant Ave
- 2715 Grant Ave Unit 3
- 2715 Grant Ave Unit 2
- 2715 Grant Ave Unit 1
- 2719 Rockefeller Ln Unit C
- 2719 Rockefeller Ln Unit A
- 2719 Rockefeller Ln Unit B
- 2721 Rockefeller Ln Unit 1
- 2723 Rockefeller Ln Unit 7