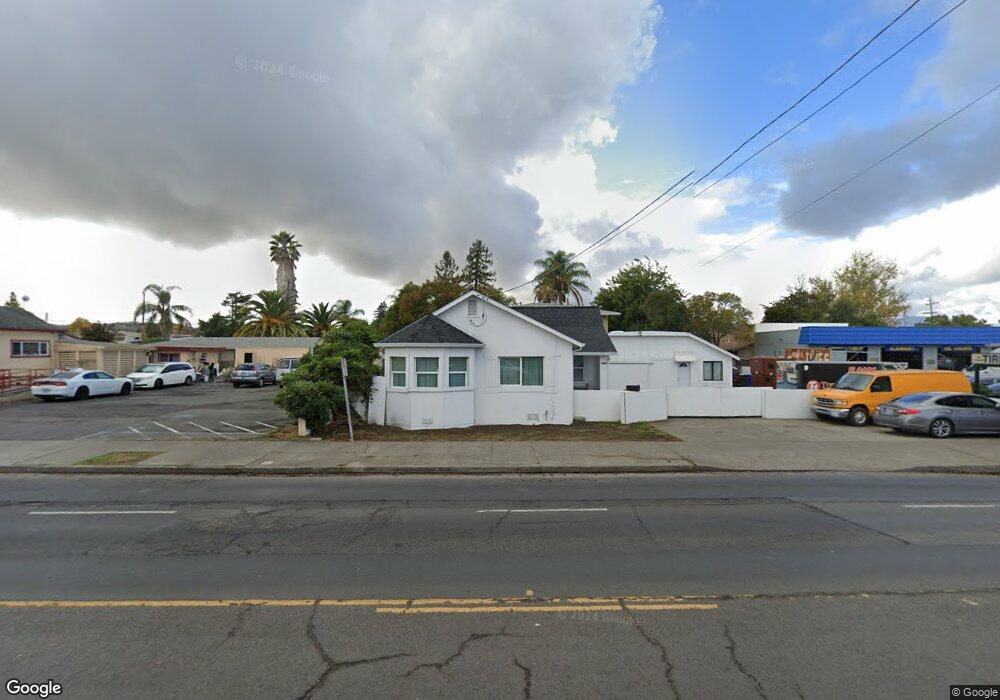
2721 Jefferson St Napa, CA 94558
McPherson NeighborhoodEstimated Value: $453,720
2
Beds
1
Bath
1,000
Sq Ft
$454/Sq Ft
Est. Value
About This Home
This home is located at 2721 Jefferson St, Napa, CA 94558 and is currently estimated at $453,720, approximately $453 per square foot. 2721 Jefferson St is a home located in Napa County with nearby schools including West Park Elementary School, Redwood Middle School, and Napa High School.
Ownership History
Date
Name
Owned For
Owner Type
Purchase Details
Closed on
Apr 29, 2024
Sold by
Morris Mark D
Bought by
Roque Gabriela and Roque Luis
Current Estimated Value
Home Financials for this Owner
Home Financials are based on the most recent Mortgage that was taken out on this home.
Original Mortgage
$75,000
Outstanding Balance
$73,849
Interest Rate
6.74%
Mortgage Type
Seller Take Back
Estimated Equity
$379,871
Purchase Details
Closed on
Jul 10, 2003
Sold by
Morris Ralph C and Morris Elizabeth J
Bought by
Morris Mark D
Purchase Details
Closed on
Feb 20, 1998
Sold by
Schultz Colleen and Hjerpe Colette
Bought by
Morris Ralph L and Morris Elizabeth J
Home Financials for this Owner
Home Financials are based on the most recent Mortgage that was taken out on this home.
Original Mortgage
$87,200
Interest Rate
7.11%
Mortgage Type
Commercial
Create a Home Valuation Report for This Property
The Home Valuation Report is an in-depth analysis detailing your home's value as well as a comparison with similar homes in the area
Home Values in the Area
Average Home Value in this Area
Purchase History
| Date | Buyer | Sale Price | Title Company |
|---|---|---|---|
| Roque Gabriela | $475,000 | Fidelity National Title | |
| Morris Mark D | -- | -- | |
| Morris Ralph L | $109,000 | First American Title Co |
Source: Public Records
Mortgage History
| Date | Status | Borrower | Loan Amount |
|---|---|---|---|
| Open | Roque Gabriela | $75,000 | |
| Previous Owner | Morris Ralph L | $87,200 |
Source: Public Records
Tax History Compared to Growth
Tax History
| Year | Tax Paid | Tax Assessment Tax Assessment Total Assessment is a certain percentage of the fair market value that is determined by local assessors to be the total taxable value of land and additions on the property. | Land | Improvement |
|---|---|---|---|---|
| 2025 | $2,610 | $484,500 | $102,000 | $382,500 |
| 2024 | $2,610 | $170,606 | $117,394 | $53,212 |
| 2023 | $2,610 | $167,262 | $115,093 | $52,169 |
| 2022 | $2,547 | $163,984 | $112,837 | $51,147 |
| 2021 | $2,515 | $160,770 | $110,625 | $50,145 |
| 2020 | $2,499 | $159,122 | $109,491 | $49,631 |
| 2019 | $2,436 | $156,003 | $107,345 | $48,658 |
| 2018 | $2,384 | $152,945 | $105,241 | $47,704 |
| 2017 | $2,316 | $149,947 | $103,178 | $46,769 |
| 2016 | $2,234 | $147,007 | $101,155 | $45,852 |
| 2015 | $2,066 | $144,800 | $99,636 | $45,164 |
| 2014 | $2,029 | $141,965 | $97,685 | $44,280 |
Source: Public Records
Map
Nearby Homes
- 1521 Park Ave
- 2431 Norton St
- 2407 Norton St
- 1671 Park Ave
- 3042 Stadium Ave
- 2119 Main St
- 2242 Louisa St
- 2057 Brown St
- 2065 Yajome St
- 34 Valley Cir W
- 2005 Adrian St
- 3122 Piedmont Ave
- 1533 G St
- 1151 La Homa Dr
- 770 Lincoln Ave Unit 32
- 770 Lincoln Ave Unit 6
- 770 Lincoln Ave Unit 62
- 882 Professional Dr
- 1759 G St
- 1961 Waverly St
- 2701 Jefferson St
- 1330 Park Ave
- 2745 Jefferson St
- 1319 Menlo Ave
- 1341 Menlo Ave
- 1350 Park Ave
- 1351 Menlo Ave
- 1360 Park Ave
- 1361 Menlo Ave
- 1370 Park Ave
- 2726 Santa Clara St
- 2815 Jefferson St
- 1320 Menlo Ave
- 2730 Santa Clara St
- 2720 Santa Clara St
- 1371 Menlo Ave
- 1380 Park Ave
- 2601 Brown St
- 1037 Ermine St
- 2607 Brown St