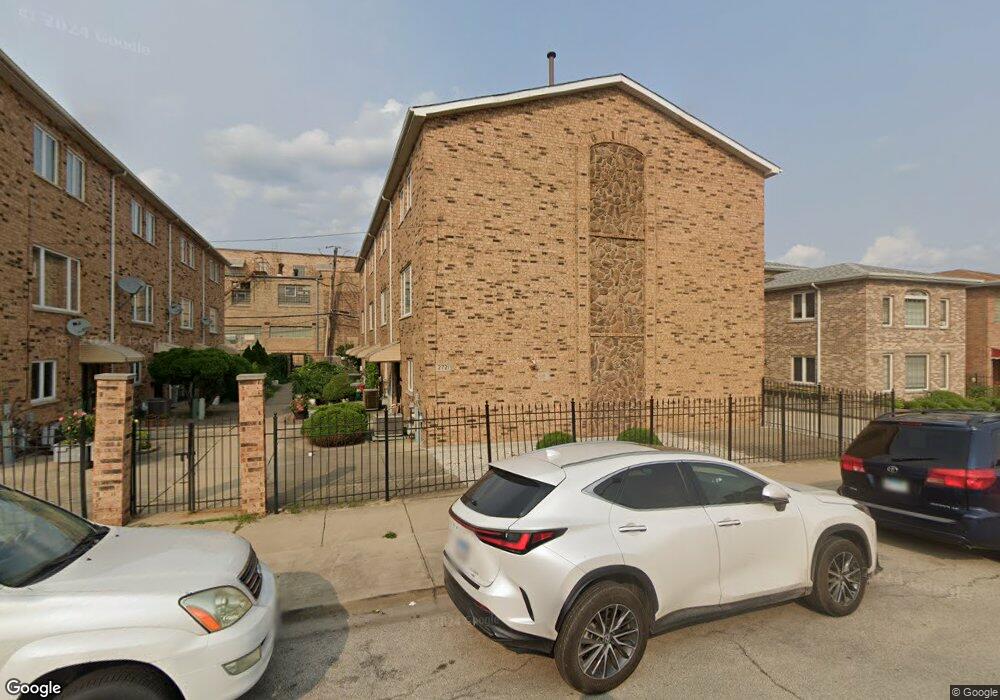
2721 S Quinn St Chicago, IL 60608
Bridgeport NeighborhoodEstimated Value: $366,000 - $523,000
3
Beds
2
Baths
1,806
Sq Ft
$246/Sq Ft
Est. Value
About This Home
This home is located at 2721 S Quinn St, Chicago, IL 60608 and is currently estimated at $444,460, approximately $246 per square foot. 2721 S Quinn St is a home located in Cook County with nearby schools including Holden Elementary School, St Therese School West, and St Barbara Elementary School.
Ownership History
Date
Name
Owned For
Owner Type
Purchase Details
Closed on
Nov 29, 1999
Sold by
Ling Ng Ling Ling and Ling Tin Ling
Bought by
Chang Cui Sharon and Chang Yau
Current Estimated Value
Home Financials for this Owner
Home Financials are based on the most recent Mortgage that was taken out on this home.
Original Mortgage
$30,000
Interest Rate
7.97%
Purchase Details
Closed on
Feb 13, 1997
Sold by
Ng Jason C and Ng Jason
Bought by
Tin Ling Ling
Create a Home Valuation Report for This Property
The Home Valuation Report is an in-depth analysis detailing your home's value as well as a comparison with similar homes in the area
Home Values in the Area
Average Home Value in this Area
Purchase History
| Date | Buyer | Sale Price | Title Company |
|---|---|---|---|
| Chang Cui Sharon | $170,000 | -- | |
| Tin Ling Ling | -- | -- |
Source: Public Records
Mortgage History
| Date | Status | Borrower | Loan Amount |
|---|---|---|---|
| Closed | Chang Cui Sharon | $30,000 |
Source: Public Records
Tax History Compared to Growth
Tax History
| Year | Tax Paid | Tax Assessment Tax Assessment Total Assessment is a certain percentage of the fair market value that is determined by local assessors to be the total taxable value of land and additions on the property. | Land | Improvement |
|---|---|---|---|---|
| 2024 | $6,126 | $39,000 | $7,113 | $31,887 |
| 2023 | $3,734 | $35,000 | $5,748 | $29,252 |
| 2022 | $3,734 | $35,000 | $5,748 | $29,252 |
| 2021 | $3,554 | $35,000 | $5,748 | $29,252 |
| 2020 | $5,382 | $29,742 | $4,598 | $25,144 |
| 2019 | $5,399 | $33,047 | $4,598 | $28,449 |
| 2018 | $3,601 | $33,047 | $4,598 | $28,449 |
| 2017 | $3,960 | $25,354 | $3,592 | $21,762 |
| 2016 | $4,221 | $25,354 | $3,592 | $21,762 |
| 2015 | $4,498 | $27,169 | $3,592 | $23,577 |
| 2014 | $3,991 | $24,077 | $2,874 | $21,203 |
| 2013 | $3,901 | $24,077 | $2,874 | $21,203 |
Source: Public Records
Map
Nearby Homes
- 2725 S Quinn St
- 2819 S Quinn St
- 2837 S Farrell St
- 2879 S Throop St
- 2520 S Stark St
- 2517 S Mary St
- 2948 S Lyman St
- 2935 S Throop St
- 2812 S Quinn St
- 2850 S Poplar Ave
- 2922 S Keeley St
- 2713 S Crowell St
- 2947 S Farrell St
- 2951 S Farrell St
- 928 W 29th St
- 2807 S Halsted St Unit 201
- 2807 S Halsted St Unit 205
- 2807 S Halsted St Unit 204
- 2828 S Emerald Ave
- 4936 S Loomis St
- 2721 S Quinn St
- 2721 S Quinn St
- 2721 S Quinn St
- 2715 S Quinn St
- 2715 S Quinn St
- 2715 S Quinn St
- 2715 S Quinn St
- 2727 S Quinn St
- 2727 S Quinn St Unit 1
- 2729 S Quinn St
- 2733 S Quinn St
- 2720 S Quinn St
- 2716 S Quinn St
- 2737 S Quinn St
- 2722 S Quinn St
- 2714 S Quinn St
- 2724 S Quinn St
- 2712 S Quinn St
- 2735 S Quinn St
- 2730 S Poplar Ave