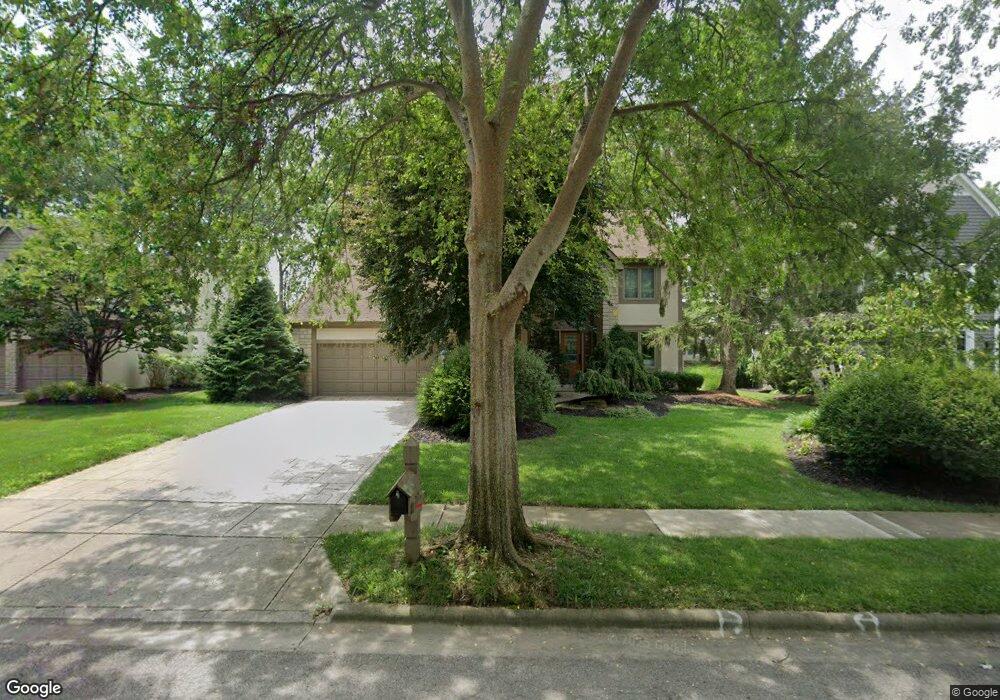
2721 Wickliffe Rd Columbus, OH 43221
Estimated Value: $758,000 - $940,000
4
Beds
4
Baths
2,614
Sq Ft
$323/Sq Ft
Est. Value
About This Home
This home is located at 2721 Wickliffe Rd, Columbus, OH 43221 and is currently estimated at $844,447, approximately $323 per square foot. 2721 Wickliffe Rd is a home located in Franklin County with nearby schools including Tremont Elementary School, Jones Middle School, and Upper Arlington High School.
Ownership History
Date
Name
Owned For
Owner Type
Purchase Details
Closed on
Jan 17, 2023
Sold by
Herman Gail E
Bought by
Saltsman Daniel and Saltsman Christine J
Current Estimated Value
Home Financials for this Owner
Home Financials are based on the most recent Mortgage that was taken out on this home.
Original Mortgage
$580,000
Outstanding Balance
$554,330
Interest Rate
4.75%
Mortgage Type
New Conventional
Estimated Equity
$290,117
Purchase Details
Closed on
Jan 17, 1997
Sold by
Cecutti Lori A
Bought by
Gail E Herman
Home Financials for this Owner
Home Financials are based on the most recent Mortgage that was taken out on this home.
Original Mortgage
$329,400
Interest Rate
7.25%
Mortgage Type
New Conventional
Purchase Details
Closed on
Jul 16, 1991
Purchase Details
Closed on
Jun 4, 1990
Create a Home Valuation Report for This Property
The Home Valuation Report is an in-depth analysis detailing your home's value as well as a comparison with similar homes in the area
Home Values in the Area
Average Home Value in this Area
Purchase History
| Date | Buyer | Sale Price | Title Company |
|---|---|---|---|
| Saltsman Daniel | $725,000 | Chicago Title | |
| Gail E Herman | $366,000 | -- | |
| -- | $263,600 | -- | |
| -- | $65,000 | -- |
Source: Public Records
Mortgage History
| Date | Status | Borrower | Loan Amount |
|---|---|---|---|
| Open | Saltsman Daniel | $580,000 | |
| Previous Owner | Gail E Herman | $329,400 |
Source: Public Records
Tax History Compared to Growth
Tax History
| Year | Tax Paid | Tax Assessment Tax Assessment Total Assessment is a certain percentage of the fair market value that is determined by local assessors to be the total taxable value of land and additions on the property. | Land | Improvement |
|---|---|---|---|---|
| 2024 | $22,379 | $248,400 | $76,720 | $171,680 |
| 2023 | $14,392 | $248,400 | $76,720 | $171,680 |
| 2022 | $14,716 | $210,600 | $47,360 | $163,240 |
| 2021 | $13,027 | $210,600 | $47,360 | $163,240 |
| 2020 | $12,912 | $210,600 | $47,360 | $163,240 |
| 2019 | $11,980 | $172,770 | $47,360 | $125,410 |
| 2018 | $11,872 | $172,770 | $47,360 | $125,410 |
| 2017 | $11,888 | $172,770 | $47,360 | $125,410 |
| 2016 | $11,842 | $179,100 | $64,680 | $114,420 |
| 2015 | $11,832 | $179,100 | $64,680 | $114,420 |
| 2014 | $11,845 | $179,100 | $64,680 | $114,420 |
| 2013 | $5,656 | $162,820 | $58,800 | $104,020 |
Source: Public Records
Map
Nearby Homes
- 3190 Kioka Ave
- 2714 Woodstock Rd
- 2731 Clifton Rd
- 3441 Sunset Dr
- 2565 Nottingham Rd
- 3163 S Dorchester Rd
- 2666 Shrewsbury Rd
- 2785 Chateau Cir Unit 69
- 2745 Cranford Rd
- 2443 Shrewsbury Rd
- 2424 Nottingham Rd
- 2782 Chateau Cir S Unit 45
- 2401 Shrewsbury Rd
- 2370 Zollinger Rd
- 2413 Edgevale Rd
- 2308 Shrewsbury Rd
- 3161 Avalon Rd
- 3414 Loire Ln
- 3041 Avalon Rd
- 3127 Griggsview Ct
- 2709 Wickliffe Rd
- 2733 Wickliffe Rd
- 2697 Wickliffe Rd
- 2745 Wickliffe Rd
- 2732 Eastcleft Dr
- 2740 Eastcleft Dr
- 2720 Eastcleft Dr
- 2746 Eastcleft Dr
- 2685 Wickliffe Rd
- 2710 Eastcleft Dr
- 2757 Wickliffe Rd
- 2758 Eastcleft Dr
- 2696 Eastcleft Dr
- 2673 Wickliffe Rd
- 2769 Wickliffe Rd
- 2770 Eastcleft Dr
- 2684 Eastcleft Dr
- 2781 Wickliffe Rd
- 2661 Wickliffe Rd
- 2782 Eastcleft Dr