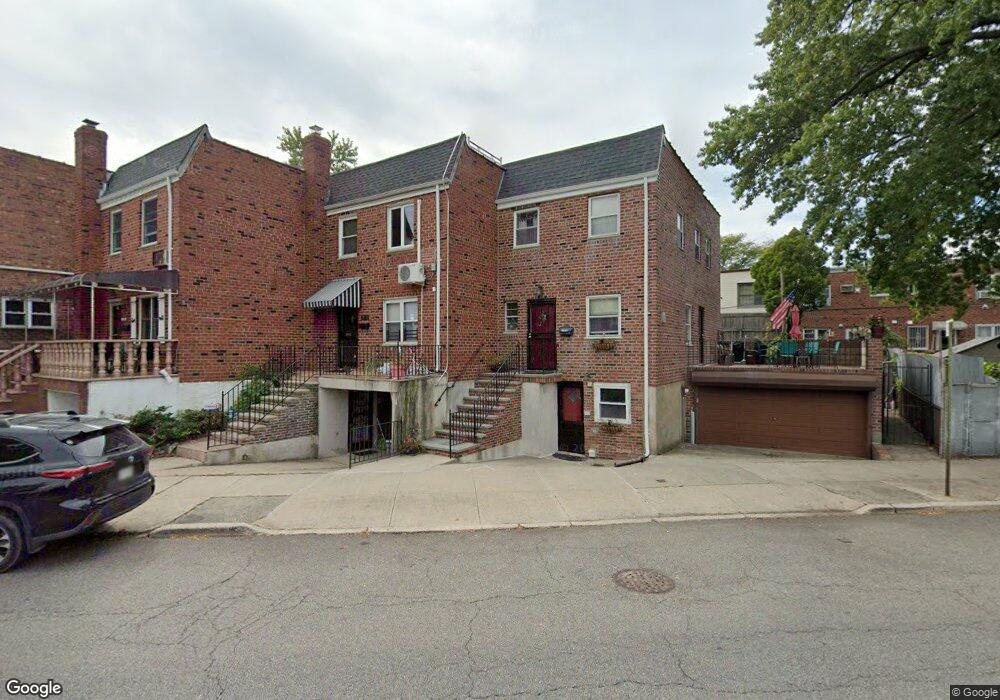
2722 Francis Lewis Blvd Flushing, NY 11358
Flushing NeighborhoodEstimated Value: $955,000 - $1,057,094
--
Bed
--
Bath
1,683
Sq Ft
$600/Sq Ft
Est. Value
About This Home
This home is located at 2722 Francis Lewis Blvd, Flushing, NY 11358 and is currently estimated at $1,010,274, approximately $600 per square foot. 2722 Francis Lewis Blvd is a home located in Queens County with nearby schools including I.S. 25 Adrien Block, Francis Lewis High School, and St. Mel’s Catholic Academy.
Ownership History
Date
Name
Owned For
Owner Type
Purchase Details
Closed on
Jun 19, 2024
Sold by
Wang Ning
Bought by
Wang Ning and Zhang Hao Sen
Current Estimated Value
Purchase Details
Closed on
Mar 11, 2011
Sold by
Homenick Anna and Maureen Homenick As Trustee
Bought by
Wang Ning
Home Financials for this Owner
Home Financials are based on the most recent Mortgage that was taken out on this home.
Original Mortgage
$324,100
Interest Rate
4.82%
Mortgage Type
Purchase Money Mortgage
Purchase Details
Closed on
Dec 3, 2010
Sold by
Homenick Anna and Homenick Maureen A
Bought by
Anna Homenick Trust and Homenick Trustee Maureen A
Purchase Details
Closed on
May 10, 1999
Sold by
Homenick Anna
Bought by
Homenick Maureen A
Create a Home Valuation Report for This Property
The Home Valuation Report is an in-depth analysis detailing your home's value as well as a comparison with similar homes in the area
Home Values in the Area
Average Home Value in this Area
Purchase History
| Date | Buyer | Sale Price | Title Company |
|---|---|---|---|
| Wang Ning | -- | -- | |
| Wang Ning | -- | -- | |
| Wang Ning | $463,000 | -- | |
| Wang Ning | $463,000 | -- | |
| Anna Homenick Trust | -- | -- | |
| Anna Homenick Trust | -- | -- | |
| Homenick Maureen A | -- | Commonwealth Land Title Ins | |
| Homenick Maureen A | -- | Commonwealth Land Title Ins |
Source: Public Records
Mortgage History
| Date | Status | Borrower | Loan Amount |
|---|---|---|---|
| Previous Owner | Wang Ning | $324,100 |
Source: Public Records
Tax History Compared to Growth
Tax History
| Year | Tax Paid | Tax Assessment Tax Assessment Total Assessment is a certain percentage of the fair market value that is determined by local assessors to be the total taxable value of land and additions on the property. | Land | Improvement |
|---|---|---|---|---|
| 2025 | $8,236 | $44,951 | $11,817 | $33,134 |
| 2024 | $7,585 | $42,408 | $12,529 | $29,879 |
| 2023 | $7,755 | $40,012 | $11,389 | $28,623 |
| 2022 | $6,571 | $52,920 | $15,900 | $37,020 |
| 2021 | $7,789 | $54,360 | $15,900 | $38,460 |
| 2020 | $7,633 | $51,420 | $15,900 | $35,520 |
| 2019 | $7,100 | $53,580 | $15,900 | $37,680 |
| 2018 | $6,499 | $33,343 | $12,937 | $20,406 |
| 2017 | $6,497 | $33,343 | $12,255 | $21,088 |
| 2016 | $6,090 | $33,343 | $12,255 | $21,088 |
| 2015 | $3,574 | $31,216 | $16,747 | $14,469 |
| 2014 | $3,574 | $29,450 | $16,878 | $12,572 |
Source: Public Records
Map
Nearby Homes
- 28-07 172nd St
- 29-31 170th St
- 29-37 168th St
- 26-23 Utopia Pkwy
- 27-01 167th St
- 2931 167th St
- 201-05 28th Ave
- 2533 Francis Lewis Blvd
- 25-31 Bayside Ln
- 199-27 26th Ave
- 19929 26th Ave
- 32-16 167th St
- 201-20 28th Ave
- 32-30 167th St
- 190-16 33rd Ave
- 16627 25th Ave
- 27-24 165th St
- 16419 32nd Ave
- 16407 27th Ave
- 20015 33rd Ave
- 28-10 171st St
- 2726 Francis Lewis Blvd
- 2718 Francis Lewis Blvd
- 2730 Francis Lewis Blvd
- 2730 Francis Lewis Blvd
- 2730 Francis Lewis Blvd
- 2735 170th St
- 2802 171st St
- 2733 170th St
- 2737 170th St
- 2731 170th St
- 27-33 170th St
- 2729 170th St
- 2727 170th St
- 2739 170th St
- 2737 170th St
- 2804 171st St
- 2741 170th St
- 2725 170th St
- 27-25 170th St