
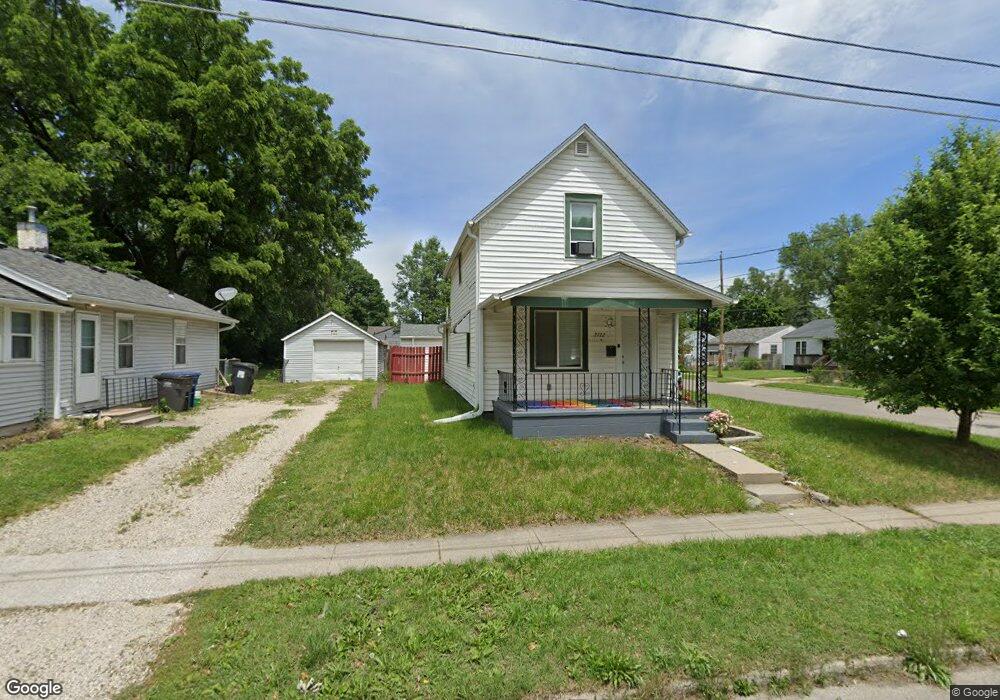
2722 Maple St Des Moines, IA 50317
Fairground Neighborhood
--
Bed
--
Bath
880
Sq Ft
5,676
Sq Ft Lot
About This Home
As of December 2021This home is located at 2722 Maple St, Des Moines, IA 50317 and is currently priced at $119,900, approximately $136 per square foot. This property was built in 1920. 2722 Maple St is a home located in Polk County with nearby schools including Willard Elementary School, Hoyt Middle School, and East High School.
Home Details
Home Type
- Single Family
Est. Annual Taxes
- $2,553
Year Built
- Built in 1920
Lot Details
- 5,676 Sq Ft Lot
- Lot Dimensions are 44x129
Interior Spaces
- 880 Sq Ft Home
- 1.5-Story Property
Community Details
- No Home Owners Association
Listing and Financial Details
- Assessor Parcel Number 05001252000000
Ownership History
Date
Name
Owned For
Owner Type
Purchase Details
Listed on
Dec 9, 2021
Closed on
Dec 9, 2021
Sold by
Kloosterman Vanessa and Kloosterman Casey
Bought by
Mcmillen Rachelle
Seller's Agent
OUTSIDE AGENT
OTHER
Buyer's Agent
Shane Torres
RE/MAX Concepts
List Price
$119,900
Sold Price
$119,900
Home Financials for this Owner
Home Financials are based on the most recent Mortgage that was taken out on this home.
Avg. Annual Appreciation
5.72%
Original Mortgage
$5,500
Outstanding Balance
$5,071
Interest Rate
2.98%
Mortgage Type
Stand Alone Second
Estimated Equity
$141,830
Purchase Details
Listed on
Oct 19, 2018
Closed on
Dec 15, 2018
Sold by
Bruton Stacy Renee and Bruton John
Bought by
Kloosterman Casey and Kloosterman Vanessa
Seller's Agent
Toren Luloff
LPT Realty, LLC
Buyer's Agent
Gary Johnson
Ellen Fitzpatrick Real Estate
List Price
$100,000
Sold Price
$100,000
Home Financials for this Owner
Home Financials are based on the most recent Mortgage that was taken out on this home.
Avg. Annual Appreciation
6.28%
Original Mortgage
$97,000
Interest Rate
4.8%
Mortgage Type
New Conventional
Purchase Details
Listed on
Nov 30, 2015
Closed on
Feb 26, 2016
Sold by
Herr Austin and Herr Tiffany
Bought by
Anderson Stacy
Seller's Agent
Robert Eisenlauer
RE/MAX Revolution
Buyer's Agent
Toren Luloff
LPT Realty, LLC
List Price
$85,000
Sold Price
$80,000
Premium/Discount to List
-$5,000
-5.88%
Home Financials for this Owner
Home Financials are based on the most recent Mortgage that was taken out on this home.
Avg. Annual Appreciation
8.30%
Purchase Details
Listed on
Apr 16, 2015
Closed on
Jun 22, 2015
Sold by
Secretary Of Hud
Bought by
Herr Austin and Springer Andrew
Seller's Agent
Gary Johnson
Ellen Fitzpatrick Real Estate
Buyer's Agent
Brandon Herr
Weichert, Realtors - 515 Agency
List Price
$30,000
Sold Price
$33,500
Premium/Discount to List
$3,500
11.67%
Home Financials for this Owner
Home Financials are based on the most recent Mortgage that was taken out on this home.
Avg. Annual Appreciation
253.09%
Original Mortgage
$98,000
Interest Rate
3.82%
Mortgage Type
Future Advance Clause Open End Mortgage
Purchase Details
Closed on
Mar 20, 2014
Sold by
Wells Fargo Bank Na
Bought by
Secretary Of Hud
Purchase Details
Closed on
Mar 13, 2014
Sold by
Gumm Shaun J and Gumm Christina M
Bought by
Wells Fargo Bank Na
Purchase Details
Closed on
Feb 13, 2002
Sold by
Ogden William B and Ogden Evelyn A
Bought by
Gumm Shaun J
Home Financials for this Owner
Home Financials are based on the most recent Mortgage that was taken out on this home.
Original Mortgage
$67,962
Interest Rate
7.23%
Mortgage Type
FHA
Similar Homes in Des Moines, IA
Create a Home Valuation Report for This Property
The Home Valuation Report is an in-depth analysis detailing your home's value as well as a comparison with similar homes in the area
Home Values in the Area
Average Home Value in this Area
Purchase History
| Date | Type | Sale Price | Title Company |
|---|---|---|---|
| Warranty Deed | $120,000 | None Available | |
| Warranty Deed | $100,000 | None Available | |
| Warranty Deed | $80,000 | None Available | |
| Special Warranty Deed | -- | Attorney | |
| Warranty Deed | -- | None Available | |
| Sheriffs Deed | $46,230 | None Available | |
| Warranty Deed | $68,000 | -- |
Source: Public Records
Mortgage History
| Date | Status | Loan Amount | Loan Type |
|---|---|---|---|
| Open | $5,500 | Stand Alone Second | |
| Open | $113,401 | New Conventional | |
| Previous Owner | $97,000 | New Conventional | |
| Previous Owner | $98,000 | Future Advance Clause Open End Mortgage | |
| Previous Owner | $64,952 | FHA | |
| Previous Owner | $15,131 | Unknown | |
| Previous Owner | $67,962 | FHA |
Source: Public Records
Property History
| Date | Event | Price | Change | Sq Ft Price |
|---|---|---|---|---|
| 05/18/2025 05/18/25 | Pending | -- | -- | -- |
| 05/14/2025 05/14/25 | Price Changed | $149,000 | -3.8% | $169 / Sq Ft |
| 05/06/2025 05/06/25 | Price Changed | $154,900 | -3.1% | $176 / Sq Ft |
| 04/26/2025 04/26/25 | For Sale | $159,900 | +33.4% | $182 / Sq Ft |
| 12/17/2021 12/17/21 | Pending | -- | -- | -- |
| 12/10/2021 12/10/21 | Sold | $119,900 | 0.0% | $136 / Sq Ft |
| 12/09/2021 12/09/21 | For Sale | $119,900 | +19.9% | $136 / Sq Ft |
| 12/17/2018 12/17/18 | Sold | $100,000 | 0.0% | $114 / Sq Ft |
| 11/07/2018 11/07/18 | Pending | -- | -- | -- |
| 10/19/2018 10/19/18 | For Sale | $100,000 | +25.0% | $114 / Sq Ft |
| 02/29/2016 02/29/16 | Sold | $80,000 | -5.9% | $78 / Sq Ft |
| 01/30/2016 01/30/16 | Pending | -- | -- | -- |
| 11/30/2015 11/30/15 | For Sale | $85,000 | +153.7% | $83 / Sq Ft |
| 06/23/2015 06/23/15 | Sold | $33,500 | +11.7% | $38 / Sq Ft |
| 06/15/2015 06/15/15 | Pending | -- | -- | -- |
| 04/16/2015 04/16/15 | For Sale | $30,000 | -- | $34 / Sq Ft |
Source: Des Moines Area Association of REALTORS®
Tax History Compared to Growth
Tax History
| Year | Tax Paid | Tax Assessment Tax Assessment Total Assessment is a certain percentage of the fair market value that is determined by local assessors to be the total taxable value of land and additions on the property. | Land | Improvement |
|---|---|---|---|---|
| 2024 | $2,464 | $125,300 | $19,400 | $105,900 |
| 2023 | $2,362 | $125,300 | $19,400 | $105,900 |
| 2022 | $2,134 | $100,200 | $15,900 | $84,300 |
| 2021 | $1,996 | $100,200 | $15,900 | $84,300 |
| 2020 | $2,068 | $88,600 | $13,900 | $74,700 |
| 2019 | $1,732 | $88,600 | $13,900 | $74,700 |
| 2018 | $1,710 | $73,000 | $12,000 | $61,000 |
| 2017 | $1,652 | $73,000 | $12,000 | $61,000 |
| 2016 | $1,834 | $69,600 | $11,200 | $58,400 |
| 2015 | $1,834 | $69,600 | $11,200 | $58,400 |
| 2014 | $1,580 | $70,600 | $11,100 | $59,500 |
Source: Public Records
Agents Affiliated with this Home
-
Seller's Agent in 2025
Mary Foley
Liberty Realty Group
(515) 577-9187
3 in this area
95 Total Sales
-
O
Seller's Agent in 2021
OUTSIDE AGENT
OTHER
22 in this area
5,734 Total Sales
-
Buyer's Agent in 2021
Shane Torres
RE/MAX
(515) 984-0222
6 in this area
629 Total Sales
-
Z
Buyer Co-Listing Agent in 2021
Zack Cregeen
RE/MAX
(515) 984-0222
4 in this area
148 Total Sales
-
Seller's Agent in 2018
Toren Luloff
LPT Realty, LLC
(515) 229-3380
1 in this area
12 Total Sales
-
Buyer's Agent in 2018
Gary Johnson
Ellen Fitzpatrick Real Estate
(515) 202-7600
117 Total Sales
Map
Source: Des Moines Area Association of REALTORS®
MLS Number: 643178
APN: 050-01252000000
Disclaimer: Certain information contained herein is derived from information provided by parties other than Homes.com. All information provided is deemed reliable, but is not guaranteed to be accurate and should be independently verified.
![]() IDX information is provided exclusively for personal, non-commercial use, and may not be used for any purpose other than to identify prospective properties consumers may be interested in purchasing. Information is deemed reliable but not guaranteed.
IDX information is provided exclusively for personal, non-commercial use, and may not be used for any purpose other than to identify prospective properties consumers may be interested in purchasing. Information is deemed reliable but not guaranteed.
Nearby Homes
- 714 E 27th St
- 809 E 26th St
- 2735 Lyon St
- 2825 Maple St
- 804 E 26th St
- 2832 Lyon St
- 1234 E 26th Ct
- 1255 E 27th Ct
- 2925 Walker St
- 2841 Des Moines St
- 2529 Des Moines St
- 2523 Des Moines St
- 1324 E 27th St
- 2638 Capitol Ave
- 1317 E 28th St
- 2540 Capitol Ave
- 2722 Chicago Ave
- 2420 Maple St
- 1263 E 25th St
- 1354 E 26th St