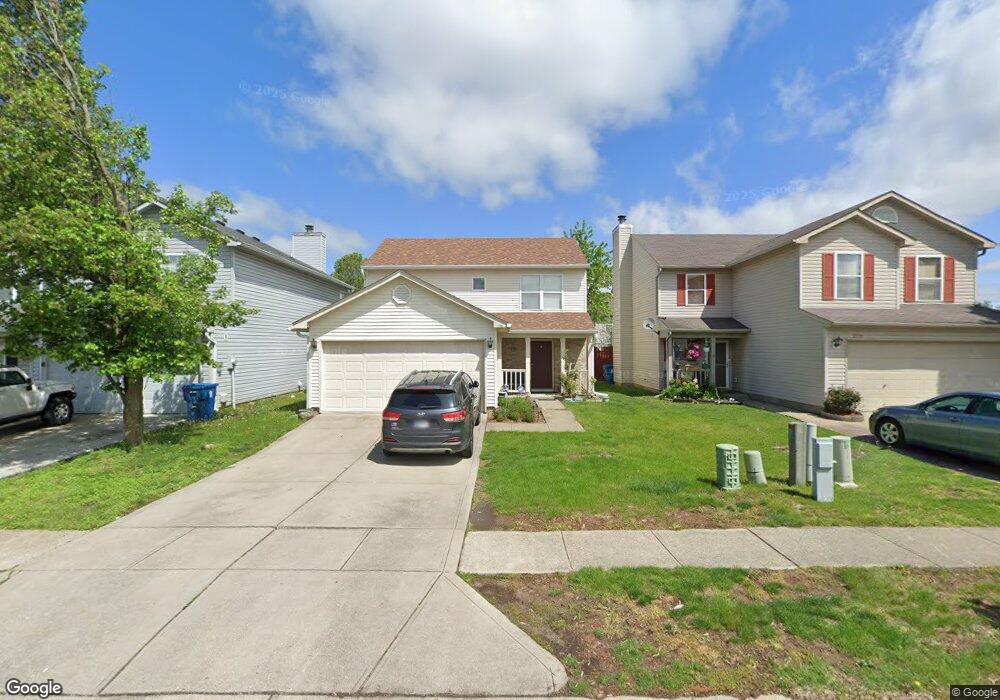
2722 Mingo Ct Indianapolis, IN 46217
Southern Dunes NeighborhoodEstimated Value: $233,000 - $236,000
3
Beds
3
Baths
1,440
Sq Ft
$163/Sq Ft
Est. Value
About This Home
This home is located at 2722 Mingo Ct, Indianapolis, IN 46217 and is currently estimated at $234,727, approximately $163 per square foot. 2722 Mingo Ct is a home located in Marion County with nearby schools including Glenns Valley Elementary School, Perry Meridian 6th Grade Academy, and Perry Meridian Middle School.
Ownership History
Date
Name
Owned For
Owner Type
Purchase Details
Closed on
Apr 6, 2018
Bought by
Thaddeus Duncan
Current Estimated Value
Home Financials for this Owner
Home Financials are based on the most recent Mortgage that was taken out on this home.
Original Mortgage
$129,980
Outstanding Balance
$111,832
Interest Rate
4.46%
Mortgage Type
New Conventional
Estimated Equity
$122,895
Purchase Details
Closed on
Jan 30, 2018
Sold by
Marion County Sheriff
Bought by
4 Siblings Investments
Purchase Details
Closed on
Jan 17, 2018
Purchase Details
Closed on
May 21, 2010
Sold by
Conway Christiaan K
Bought by
Merrell Stephani R
Home Financials for this Owner
Home Financials are based on the most recent Mortgage that was taken out on this home.
Original Mortgage
$100,644
Interest Rate
5.12%
Mortgage Type
FHA
Create a Home Valuation Report for This Property
The Home Valuation Report is an in-depth analysis detailing your home's value as well as a comparison with similar homes in the area
Home Values in the Area
Average Home Value in this Area
Purchase History
| Date | Buyer | Sale Price | Title Company |
|---|---|---|---|
| Thaddeus Duncan | $134,000 | -- | |
| Duncan Thaddeus | $134,000 | First American Title | |
| 4 Siblings Investments | -- | -- | |
| -- | $110,000 | -- | |
| Merrell Stephani R | -- | Investors Titlecorp |
Source: Public Records
Mortgage History
| Date | Status | Borrower | Loan Amount |
|---|---|---|---|
| Open | Duncan Thaddeus | $129,980 | |
| Previous Owner | Merrell Stephani R | $100,644 |
Source: Public Records
Tax History Compared to Growth
Tax History
| Year | Tax Paid | Tax Assessment Tax Assessment Total Assessment is a certain percentage of the fair market value that is determined by local assessors to be the total taxable value of land and additions on the property. | Land | Improvement |
|---|---|---|---|---|
| 2024 | $2,768 | $226,300 | $24,500 | $201,800 |
| 2023 | $2,768 | $215,400 | $24,500 | $190,900 |
| 2022 | $2,583 | $195,800 | $24,500 | $171,300 |
| 2021 | $2,128 | $162,500 | $24,500 | $138,000 |
| 2020 | $1,709 | $133,600 | $24,500 | $109,100 |
| 2019 | $3,461 | $130,000 | $15,500 | $114,500 |
| 2018 | $3,183 | $120,000 | $15,500 | $104,500 |
| 2017 | $1,368 | $111,200 | $15,500 | $95,700 |
| 2016 | $1,235 | $103,600 | $15,500 | $88,100 |
| 2014 | $948 | $96,600 | $15,500 | $81,100 |
| 2013 | $1,017 | $96,600 | $15,500 | $81,100 |
Source: Public Records
Map
Nearby Homes
- 7141 Wellwood Dr
- 2611 Santaro Ct
- 7120 Red Lake Ct
- 7208 Parklake Place
- 7305 Wellwood Dr
- 7027 Harness Lakes Dr
- 2429 Boyer Ln
- 7123 Forrester Ln
- 7232 Wyatt Ln
- 7042 Tyler Ln
- 7301 Parklake Place
- 6951 Governors Point Blvd
- 2623 Senators Way
- 6826 Earlswood Dr
- 6749 Everbloom Ln
- 2511 Big Bear Ln
- 3017 Everbloom Way
- 6666 Black Antler Cir
- 2531 Redland Ln
- 2823 Redland Ln