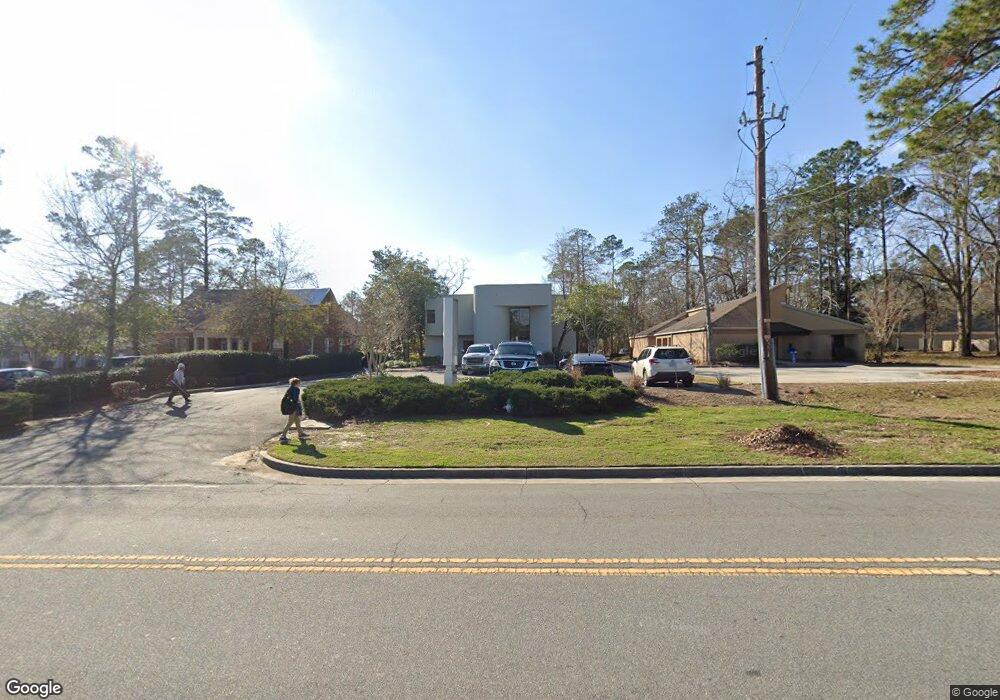
2722 N Oak St Valdosta, GA 31602
Estimated Value: $658,024
--
Bed
--
Bath
6,150
Sq Ft
$107/Sq Ft
Est. Value
About This Home
This home is located at 2722 N Oak St, Valdosta, GA 31602 and is currently estimated at $658,024, approximately $106 per square foot. 2722 N Oak St is a home located in Lowndes County with nearby schools including Sallas Mahone Elementary School, Valdosta Middle School, and Valdosta High School.
Ownership History
Date
Name
Owned For
Owner Type
Purchase Details
Closed on
May 13, 2021
Sold by
Kirbo James L
Bought by
S8d Properties Llc
Current Estimated Value
Home Financials for this Owner
Home Financials are based on the most recent Mortgage that was taken out on this home.
Original Mortgage
$405,174
Outstanding Balance
$306,176
Interest Rate
3%
Mortgage Type
Commercial
Estimated Equity
$351,848
Purchase Details
Closed on
Sep 5, 2008
Sold by
Northwood Ventures
Bought by
Northwood Ventures Llc
Purchase Details
Closed on
Oct 2, 2006
Sold by
Ipg Inc
Bought by
Kirbo Joseph L
Home Financials for this Owner
Home Financials are based on the most recent Mortgage that was taken out on this home.
Original Mortgage
$225,000
Interest Rate
6.36%
Purchase Details
Closed on
Oct 19, 2005
Sold by
Valdosta Photo 1 Enterpris
Bought by
Ipg Inc
Purchase Details
Closed on
Mar 25, 2005
Sold by
Ipg Incorporated
Bought by
Valdosta Photo 1 Enterprises Inc
Purchase Details
Closed on
May 2, 1980
Bought by
Kirbo Joe L & Ipg Inc
Create a Home Valuation Report for This Property
The Home Valuation Report is an in-depth analysis detailing your home's value as well as a comparison with similar homes in the area
Home Values in the Area
Average Home Value in this Area
Purchase History
| Date | Buyer | Sale Price | Title Company |
|---|---|---|---|
| S8d Properties Llc | $450,000 | -- | |
| Northwood Ventures Llc | -- | -- | |
| Kirbo Joseph L | $225,000 | -- | |
| Ipg Inc | -- | -- | |
| Valdosta Photo 1 Enterprises Inc | $245,000 | -- | |
| Kirbo Joe L & Ipg Inc | $17,500 | -- |
Source: Public Records
Mortgage History
| Date | Status | Borrower | Loan Amount |
|---|---|---|---|
| Open | S8d Properties Llc | $405,174 | |
| Previous Owner | Kirbo Joseph L | $225,000 |
Source: Public Records
Tax History Compared to Growth
Tax History
| Year | Tax Paid | Tax Assessment Tax Assessment Total Assessment is a certain percentage of the fair market value that is determined by local assessors to be the total taxable value of land and additions on the property. | Land | Improvement |
|---|---|---|---|---|
| 2024 | $6,077 | $217,587 | $27,990 | $189,597 |
| 2023 | $6,077 | $159,068 | $27,990 | $131,078 |
| 2022 | $5,376 | $159,068 | $27,990 | $131,078 |
| 2021 | $4,112 | $118,266 | $27,990 | $90,276 |
| 2020 | $4,383 | $123,412 | $27,990 | $95,422 |
| 2019 | $4,564 | $128,558 | $27,990 | $100,568 |
| 2018 | $4,746 | $131,988 | $27,990 | $103,998 |
| 2017 | $4,965 | $137,134 | $27,990 | $109,144 |
| 2016 | $5,082 | $140,564 | $27,990 | $112,574 |
| 2015 | $4,918 | $174,354 | $27,990 | $146,364 |
| 2014 | $4,883 | $144,704 | $28,836 | $115,868 |
Source: Public Records
Map
Nearby Homes
- 410 Georgetown Cir
- 409 Georgetown Cir
- 422 Georgetown Cir
- 312 Eager Rd
- 2908 Fawnwood Cir
- 314 Oak Center Place
- 315 Canna Dr
- 213 E Northside Dr
- 333 Canna Dr
- 2905 Northfield Rd
- 2503 N Oak St
- 2919 Thea Ln
- 2965 N Ashley St
- 323 Betty jo Dr
- 2826 Bud McKey Cir
- 309 Barfield Dr
- 3022 Blandwood Rd
- 3012 Wendover Rd
- 404 Northfield Rd
- 2413 Knox Dr
- 2724 N Oak St
- 440 Georgetown Cir
- 439 Georgetown Cir
- 2717 Windemere Dr
- 438 Georgetown Cir
- 437 Georgetown Cir
- 400 Georgetown Cir
- 307 Georgetown Cir
- 436 Georgetown Cir
- 402 Georgetown Cir
- 435 Georgetown Cir
- 434 Georgetown Cir
- 401 Georgetown Cir
- 433 Georgetown Cir
- 2723 Windemere Dr
- 432 Georgetown Cir
- 403 Georgetown Cir
- 406 Georgetown Cir
- 431 Georgetown Cir
- 405 Georgetown Cir