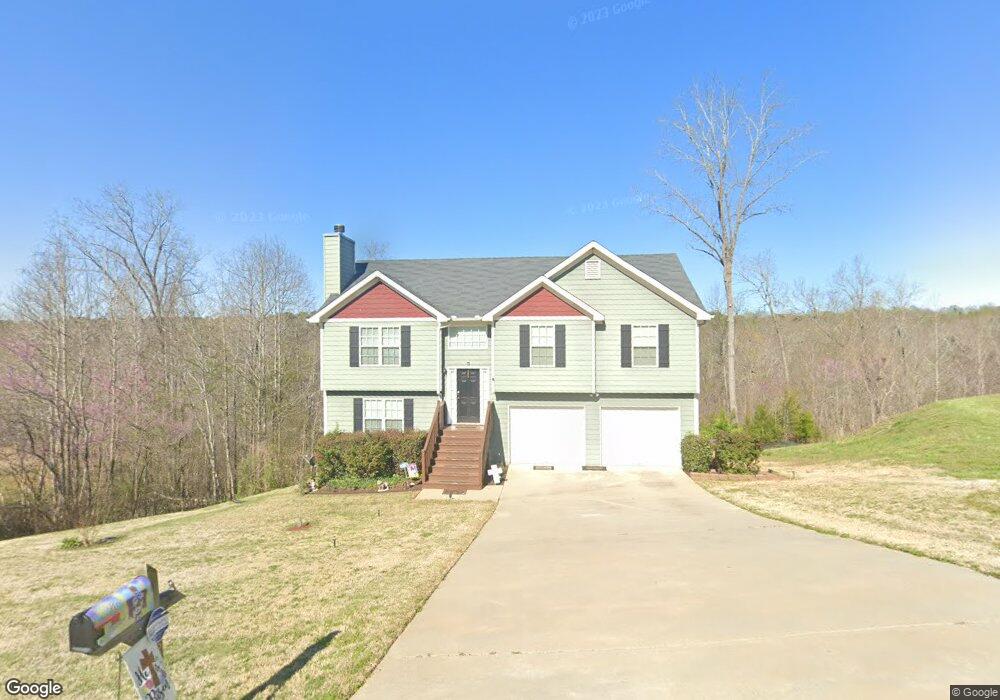
2722 Summer Creek Dr Unit 3 Gainesville, GA 30507
Southeast Gainesville NeighborhoodEstimated Value: $338,000 - $380,000
3
Beds
2
Baths
1,500
Sq Ft
$239/Sq Ft
Est. Value
About This Home
This home is located at 2722 Summer Creek Dr Unit 3, Gainesville, GA 30507 and is currently estimated at $358,507, approximately $239 per square foot. 2722 Summer Creek Dr Unit 3 is a home located in Hall County with nearby schools including Chicopee Elementary School, South Hall Middle School, and Johnson High School.
Ownership History
Date
Name
Owned For
Owner Type
Purchase Details
Closed on
Dec 28, 2015
Sold by
Dorough Michael A
Bought by
Widdowson Dorough Michael A and Widdowson Dorough Julie
Current Estimated Value
Home Financials for this Owner
Home Financials are based on the most recent Mortgage that was taken out on this home.
Original Mortgage
$136,580
Outstanding Balance
$109,795
Interest Rate
3.97%
Mortgage Type
New Conventional
Estimated Equity
$248,712
Purchase Details
Closed on
Oct 1, 2014
Sold by
H & S Properties Llp
Bought by
Breedlove Homes Llc
Home Financials for this Owner
Home Financials are based on the most recent Mortgage that was taken out on this home.
Original Mortgage
$70,000
Interest Rate
4.17%
Mortgage Type
New Conventional
Create a Home Valuation Report for This Property
The Home Valuation Report is an in-depth analysis detailing your home's value as well as a comparison with similar homes in the area
Home Values in the Area
Average Home Value in this Area
Purchase History
| Date | Buyer | Sale Price | Title Company |
|---|---|---|---|
| Widdowson Dorough Michael A | $170,725 | -- | |
| Dorough Michael A | $170,725 | -- | |
| Breedlove Homes Llc | $70,000 | -- |
Source: Public Records
Mortgage History
| Date | Status | Borrower | Loan Amount |
|---|---|---|---|
| Open | Dorough Michael A | $136,580 | |
| Closed | Widdowson Dorough Michael A | $136,580 | |
| Previous Owner | Breedlove Homes Llc | $70,000 |
Source: Public Records
Tax History Compared to Growth
Tax History
| Year | Tax Paid | Tax Assessment Tax Assessment Total Assessment is a certain percentage of the fair market value that is determined by local assessors to be the total taxable value of land and additions on the property. | Land | Improvement |
|---|---|---|---|---|
| 2025 | $2,804 | $114,400 | $11,640 | $102,760 |
| 2024 | $2,900 | $111,000 | $11,640 | $99,360 |
| 2023 | $2,787 | $122,000 | $11,640 | $110,360 |
| 2022 | $2,454 | $89,200 | $11,640 | $77,560 |
| 2021 | $2,189 | $77,440 | $11,640 | $65,800 |
| 2020 | $2,172 | $74,600 | $11,640 | $62,960 |
| 2019 | $2,194 | $74,800 | $11,640 | $63,160 |
| 2018 | $1,998 | $63,480 | $7,760 | $55,720 |
| 2017 | $1,848 | $58,880 | $7,760 | $51,120 |
| 2016 | $1,829 | $61,000 | $7,760 | $53,240 |
| 2015 | $387 | $7,760 | $7,760 | $0 |
| 2014 | $387 | $10,800 | $10,800 | $0 |
Source: Public Records
Map
Nearby Homes
- 2779 Summer Creek Dr
- 2948 Colony Ct
- 4473 Circassian Place
- 2460 Calvary Church Rd
- 2805 Glendale Dr
- 5261 Hopewell Ln
- 3927 Celtic Ct
- 6064 Cane Crossing Dr
- 6021 Cane Crossing Dr
- 4129 Village Preserve Way
- 01 Candler Rd
- 4044 Amberleigh Trace
- 4135 Ashford Way
- 4621 Chartwell Chase Ct
- 4715 Creek Wood Dr
- 4013 Amberleigh Trace
- 0 Marble Arch Way
- 4234 Quail Creek Dr
- 3969 Bolding Rd
- 4609 Hunters Ct
- 2722 Summer Creek Dr
- 2722 Summer Creek
- 2718 Summer Creek Dr
- 2718 Summer Creek Dr Unit LOT 2
- 2725 Summer Creek Dr
- 2725 Summer Creek Dr
- 2726 Summer Creek Dr Unit 4
- 2726 Summer Creek Dr
- 2726 Summer Creek Dr
- 2726 Summer Creek Dr Unit LOT 4
- 2719 Summer Creek Dr Unit LOT 35
- 2715 Summer Creek Dr
- 2714 Summer Creek Dr
- 2714 Summer Creek Dr
- 2714 Summer Creek Dr Unit LOT 1
- 2715 Summer Creek Dr Unit 36
- 2729 Summer Creek Dr
- 2730 Summer Creek Dr Unit LOT 5