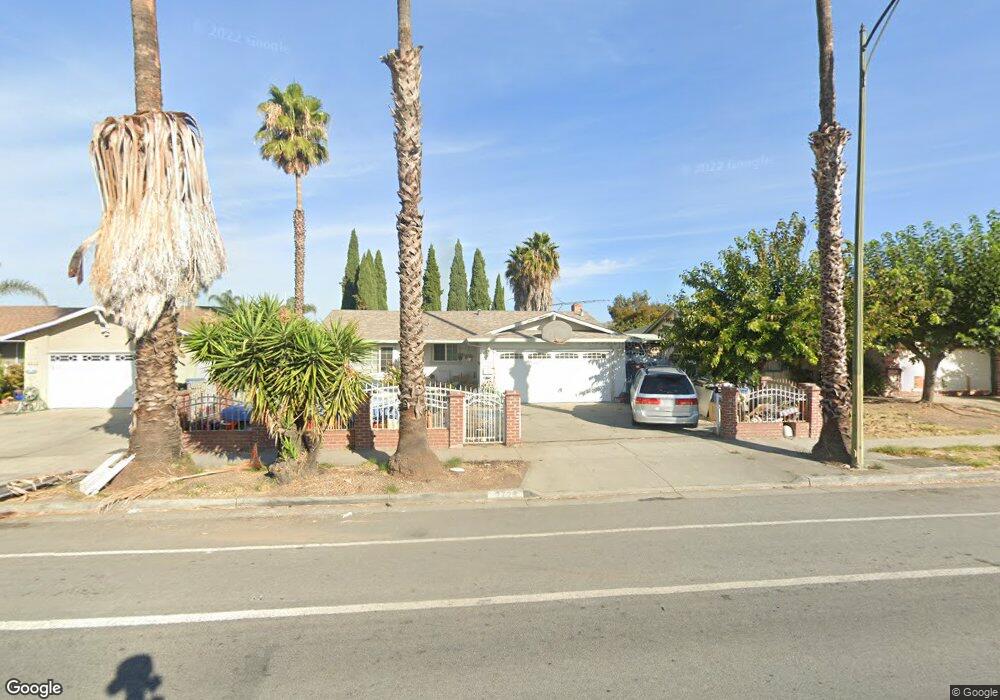
2723 Cunningham Ave San Jose, CA 95148
Ocala-Sundown NeighborhoodEstimated Value: $1,014,000 - $1,225,000
3
Beds
2
Baths
1,287
Sq Ft
$857/Sq Ft
Est. Value
About This Home
This home is located at 2723 Cunningham Ave, San Jose, CA 95148 and is currently estimated at $1,103,599, approximately $857 per square foot. 2723 Cunningham Ave is a home located in Santa Clara County with nearby schools including Thomas P. Ryan Elementary School, Ocala Middle School, and Mt. Pleasant High School.
Ownership History
Date
Name
Owned For
Owner Type
Purchase Details
Closed on
Apr 6, 2022
Sold by
Du Thomas M
Bought by
Du Thomas M and Du Thanh C
Current Estimated Value
Home Financials for this Owner
Home Financials are based on the most recent Mortgage that was taken out on this home.
Original Mortgage
$500,000
Outstanding Balance
$471,684
Interest Rate
4.67%
Mortgage Type
New Conventional
Estimated Equity
$631,915
Purchase Details
Closed on
Aug 29, 2000
Sold by
Tran Phuonglinh T
Bought by
Du Thanh C
Home Financials for this Owner
Home Financials are based on the most recent Mortgage that was taken out on this home.
Original Mortgage
$341,500
Interest Rate
8.2%
Purchase Details
Closed on
Aug 24, 2000
Sold by
Appellanes Fortunato E and Appellanes Judith C
Bought by
Du Thomas M and Du Thanh C
Home Financials for this Owner
Home Financials are based on the most recent Mortgage that was taken out on this home.
Original Mortgage
$341,500
Interest Rate
8.2%
Create a Home Valuation Report for This Property
The Home Valuation Report is an in-depth analysis detailing your home's value as well as a comparison with similar homes in the area
Home Values in the Area
Average Home Value in this Area
Purchase History
| Date | Buyer | Sale Price | Title Company |
|---|---|---|---|
| Du Thomas M | -- | New Title Company Name | |
| Du Thanh C | -- | Old Republic Title Company | |
| Du Thomas M | -- | Old Republic Title Company | |
| Du Thomas M | $380,000 | Old Republic Title Company |
Source: Public Records
Mortgage History
| Date | Status | Borrower | Loan Amount |
|---|---|---|---|
| Open | Du Thomas M | $500,000 | |
| Previous Owner | Du Thomas M | $341,500 |
Source: Public Records
Tax History
| Year | Tax Paid | Tax Assessment Tax Assessment Total Assessment is a certain percentage of the fair market value that is determined by local assessors to be the total taxable value of land and additions on the property. | Land | Improvement |
|---|---|---|---|---|
| 2025 | $8,861 | $572,578 | $229,027 | $343,551 |
| 2024 | $8,861 | $561,352 | $224,537 | $336,815 |
| 2023 | $8,681 | $550,346 | $220,135 | $330,211 |
| 2022 | $8,514 | $539,556 | $215,819 | $323,737 |
| 2021 | $8,218 | $528,978 | $211,588 | $317,390 |
| 2020 | $8,055 | $523,555 | $209,419 | $314,136 |
| 2019 | $7,832 | $513,290 | $205,313 | $307,977 |
| 2018 | $7,728 | $503,227 | $201,288 | $301,939 |
| 2017 | $7,753 | $493,361 | $197,342 | $296,019 |
| 2016 | $7,316 | $483,688 | $193,473 | $290,215 |
| 2015 | $7,310 | $476,423 | $190,567 | $285,856 |
| 2014 | $6,790 | $467,092 | $186,835 | $280,257 |
Source: Public Records
Map
Nearby Homes
- 1776 Home Gate Dr
- 3165 Coldwater Dr
- 1572 Amesbury Way
- 2030 Flintbury Ct
- 3248 Rocky Mountain Dr
- 1729 Adrian Way
- 1278 Leeward Dr
- 3282 Mount Everest Dr
- 2571 Gumdrop Dr
- 2667 Sand Point Dr
- 10230 Griffith St
- 2808 Quest Ct
- 3381 Mount Everest Dr
- 10121 Torrance Ave
- 3410 Gila Dr
- 3455 Cuesta Dr
- 3485 Rubion Ct
- 1864 Loyola Dr
- 13881 Story Rd
- 1542 Harvest Dr
- 2715 Cunningham Ave
- 2731 Cunningham Ave
- 2694 Pixanne Ct
- 2707 Cunningham Ave
- 2688 Pixanne Ct
- 2698 Pixanne Ct
- 2699 Cunningham Ave
- 2684 Pixanne Ct
- 2691 Cunningham Ave
- 2825 Cunningham Ave
- 2819 Cunningham Ave
- 2678 Pixanne Ct
- 2697 Pixanne Ct
- 2683 Cunningham Ave
- 2691 Pixanne Ct
- 2674 Pixanne Ct
- 2687 Pixanne Ct
- 2681 Pixanne Ct
- 2015 Cunningham Ct
- 2013 Cunningham Ct
Your Personal Tour Guide
Ask me questions while you tour the home.