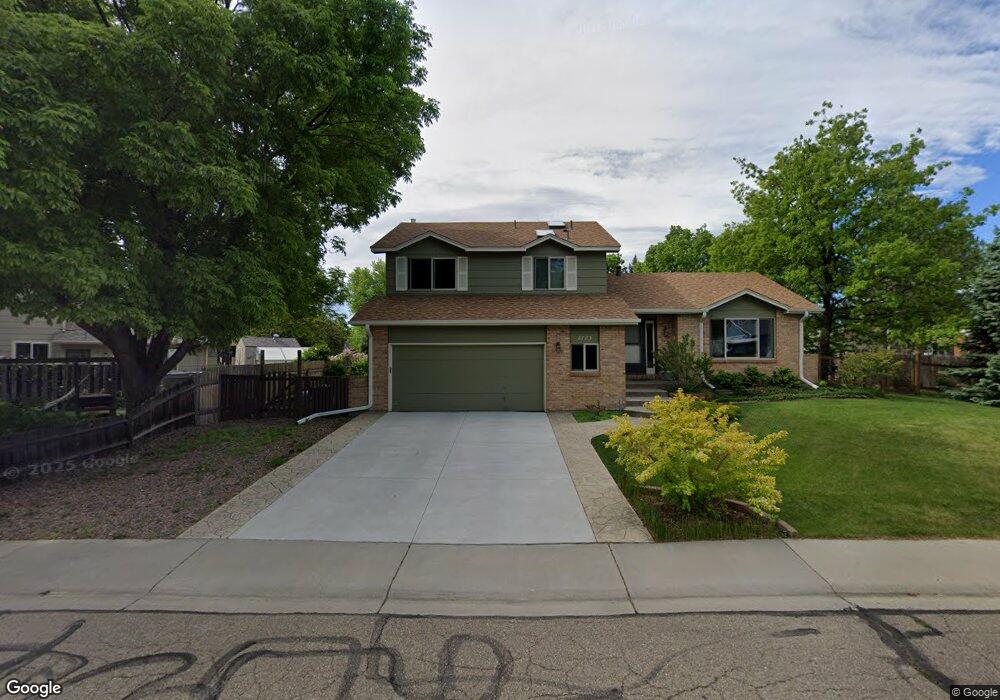
2723 Geneva Place Longmont, CO 80503
Longmont Estates NeighborhoodEstimated Value: $610,000 - $682,000
3
Beds
3
Baths
1,894
Sq Ft
$333/Sq Ft
Est. Value
About This Home
This home is located at 2723 Geneva Place, Longmont, CO 80503 and is currently estimated at $631,070, approximately $333 per square foot. 2723 Geneva Place is a home located in Boulder County with nearby schools including Longmont Estates Elementary School, Westview Middle School, and Silver Creek High School.
Ownership History
Date
Name
Owned For
Owner Type
Purchase Details
Closed on
Aug 5, 2005
Sold by
Lowrie Wesley J and Lowrie Debra D
Bought by
Ohara William H and Ohara Sherri S
Current Estimated Value
Home Financials for this Owner
Home Financials are based on the most recent Mortgage that was taken out on this home.
Original Mortgage
$206,800
Outstanding Balance
$107,866
Interest Rate
5.55%
Mortgage Type
Fannie Mae Freddie Mac
Estimated Equity
$523,204
Purchase Details
Closed on
Mar 23, 1998
Sold by
Trujillo Catherine A
Bought by
Lowrie Wesley J and Lowrie Debra D
Home Financials for this Owner
Home Financials are based on the most recent Mortgage that was taken out on this home.
Original Mortgage
$141,600
Interest Rate
7.12%
Purchase Details
Closed on
Oct 16, 1995
Sold by
Trujillo Joseph E and Trujillo Catherine A
Bought by
Trujillo Catherine A
Purchase Details
Closed on
Feb 27, 1987
Bought by
Ohara Sherri S and Ohara William H
Purchase Details
Closed on
May 10, 1983
Bought by
Ohara Sherri S and Ohara William H
Create a Home Valuation Report for This Property
The Home Valuation Report is an in-depth analysis detailing your home's value as well as a comparison with similar homes in the area
Home Values in the Area
Average Home Value in this Area
Purchase History
| Date | Buyer | Sale Price | Title Company |
|---|---|---|---|
| Ohara William H | $258,500 | Fahtco | |
| Lowrie Wesley J | $177,000 | First American Heritage Titl | |
| Trujillo Catherine A | -- | -- | |
| Ohara Sherri S | $105,000 | -- | |
| Ohara Sherri S | $86,800 | -- |
Source: Public Records
Mortgage History
| Date | Status | Borrower | Loan Amount |
|---|---|---|---|
| Open | Ohara William H | $206,800 | |
| Previous Owner | Lowrie Wesley J | $141,600 |
Source: Public Records
Tax History Compared to Growth
Tax History
| Year | Tax Paid | Tax Assessment Tax Assessment Total Assessment is a certain percentage of the fair market value that is determined by local assessors to be the total taxable value of land and additions on the property. | Land | Improvement |
|---|---|---|---|---|
| 2025 | $3,011 | $37,825 | $10,069 | $27,756 |
| 2024 | $3,011 | $37,825 | $10,069 | $27,756 |
| 2023 | $2,970 | $38,177 | $11,236 | $30,626 |
| 2022 | $2,355 | $30,747 | $8,660 | $22,087 |
| 2021 | $3,082 | $31,632 | $8,909 | $22,723 |
| 2020 | $2,557 | $26,327 | $7,222 | $19,105 |
| 2019 | $2,517 | $26,327 | $7,222 | $19,105 |
| 2018 | $2,347 | $24,710 | $7,272 | $17,438 |
| 2017 | $2,315 | $27,319 | $8,040 | $19,279 |
| 2016 | $2,150 | $22,495 | $9,711 | $12,784 |
| 2015 | $2,049 | $18,021 | $4,696 | $13,325 |
| 2014 | $1,683 | $18,021 | $4,696 | $13,325 |
Source: Public Records
Map
Nearby Homes
- 1506 Fisk Ct
- 1448 Elmhurst Ct
- 2871 Humboldt Cir
- 1451 Elmhurst Dr
- 2888 Humboldt Cir
- 2623 Elmhurst Cir
- 1429 Auburn Ct
- 2810 Humboldt Cir
- 28 University Dr
- 1460 Belmont Dr
- 2325 15th Ave
- 1835 Cambridge Dr
- 1379 Charles Dr Unit 7
- 1379 Charles Dr Unit 4
- 1379 Charles Dr Unit 5
- 1379 Charles Dr Unit 3
- 2959 Lakeshore Dr
- 1440 Northwestern Rd
- 1345 Northwestern Rd
- 1545 Drake St
- 1634 Geneva Cir
- 2731 Geneva Place
- 1624 Geneva Cir
- 2722 Geneva Place
- 2712 Geneva Place
- 1644 Geneva Cir
- 2730 Geneva Place
- 2706 Geneva Place
- 2735 Geneva Place
- 1631 Geneva Cir
- 1627 Geneva Cir
- 1635 Geneva Cir
- 1612 Geneva Cir
- 2743 Denver Ave
- 2741 Denver Ave
- 2739 Geneva Place
- 1623 Geneva Cir
- 1648 Geneva Cir
- 2801 Denver Ave
- 2733 Denver Ave