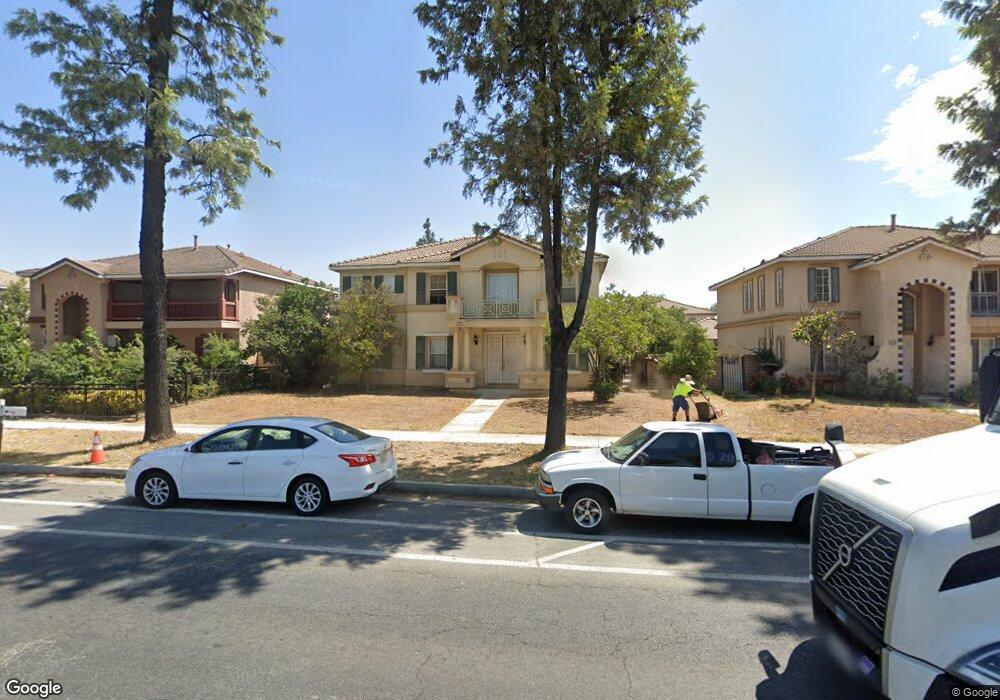
2723 S Euclid Ave Ontario, CA 91762
Ontario Ranch NeighborhoodEstimated Value: $879,679 - $994,000
5
Beds
3
Baths
2,705
Sq Ft
$354/Sq Ft
Est. Value
About This Home
This home is located at 2723 S Euclid Ave, Ontario, CA 91762 and is currently estimated at $957,670, approximately $354 per square foot. 2723 S Euclid Ave is a home located in San Bernardino County with nearby schools including Liberty Elementary School, Woodcrest Junior High, and Chino High School.
Ownership History
Date
Name
Owned For
Owner Type
Purchase Details
Closed on
May 28, 2019
Sold by
Lao Raymond and Lu Fang Chih
Bought by
Lao Raymond and Lu Fang Chih
Current Estimated Value
Purchase Details
Closed on
Dec 30, 2014
Sold by
Lao Raymond
Bought by
Lao Raymond and Lu Fang Chih
Home Financials for this Owner
Home Financials are based on the most recent Mortgage that was taken out on this home.
Original Mortgage
$367,500
Outstanding Balance
$282,730
Interest Rate
3.96%
Mortgage Type
New Conventional
Estimated Equity
$674,940
Purchase Details
Closed on
Mar 3, 2007
Sold by
Lao Henry
Bought by
Lao Raymond
Purchase Details
Closed on
Dec 5, 2001
Sold by
Wl Homes Llc
Bought by
Lao Henry
Home Financials for this Owner
Home Financials are based on the most recent Mortgage that was taken out on this home.
Original Mortgage
$201,586
Interest Rate
7.08%
Mortgage Type
Stand Alone First
Purchase Details
Closed on
Dec 27, 2000
Sold by
Wh Ontario Associates Lp
Bought by
Wl Homes Llc and John Laing Homes
Create a Home Valuation Report for This Property
The Home Valuation Report is an in-depth analysis detailing your home's value as well as a comparison with similar homes in the area
Home Values in the Area
Average Home Value in this Area
Purchase History
| Date | Buyer | Sale Price | Title Company |
|---|---|---|---|
| Lao Raymond | -- | None Available | |
| Lao Raymond | -- | Western Resources Title Co | |
| Lao Raymond | -- | None Available | |
| Lao Henry | $288,000 | Chicago Title | |
| Wl Homes Llc | -- | Chicago Title Co |
Source: Public Records
Mortgage History
| Date | Status | Borrower | Loan Amount |
|---|---|---|---|
| Open | Lao Raymond | $367,500 | |
| Previous Owner | Lao Henry | $201,586 |
Source: Public Records
Tax History Compared to Growth
Tax History
| Year | Tax Paid | Tax Assessment Tax Assessment Total Assessment is a certain percentage of the fair market value that is determined by local assessors to be the total taxable value of land and additions on the property. | Land | Improvement |
|---|---|---|---|---|
| 2025 | $5,777 | $425,440 | $88,642 | $336,798 |
| 2024 | $5,777 | $417,098 | $86,904 | $330,194 |
| 2023 | $5,627 | $408,920 | $85,200 | $323,720 |
| 2022 | $5,578 | $400,902 | $83,529 | $317,373 |
| 2021 | $5,469 | $393,041 | $81,891 | $311,150 |
| 2020 | $5,391 | $389,011 | $81,051 | $307,960 |
| 2019 | $5,295 | $381,384 | $79,462 | $301,922 |
| 2018 | $5,181 | $373,906 | $77,904 | $296,002 |
| 2017 | $5,087 | $366,574 | $76,376 | $290,198 |
| 2016 | $4,800 | $359,386 | $74,878 | $284,508 |
| 2015 | $4,631 | $353,987 | $73,753 | $280,234 |
| 2014 | $4,538 | $347,053 | $72,308 | $274,745 |
Source: Public Records
Map
Nearby Homes
- 209 W Via Rua Flores
- 320 W Walnut St Unit 6
- 2890 S Via Belamaria
- 12482 Silkleaf Ave
- 12476 Park Ave
- 570 E Banyan Ct
- 6763 Poinsettia Ct
- 12834 Zinnea Ave
- 554 E Fairfield Ct
- 2350 S Via Esplanade Unit 31
- 6766 Foxcroft Ct
- 2333 S Via Esplanade Unit 25
- 2343 S Via Veranda Unit 10
- 12891 Somerset Place
- 6703 Poinsettia Ct
- 6736 Aster Ct
- 6667 King St
- 6703 Aster Ct
- 13028 Melon Ave
- 310 E Philadelphia St
- 2731 S Euclid Ave
- 2715 S Euclid Ave
- 2734 S Lemon Place
- 2695 S Euclid Ave
- 2714 S Lemon Place
- 2716 S Lemon Place
- 2645 S Euclid Ave
- 116 E Hazeltine St
- 132 E Hazeltine St
- 148 E Hazeltine St
- 2725 S Lemon Place
- 202 E Blue Jay Way
- 2733 S Lemon Place
- 2639 S Euclid Ave
- 164 E Hazeltine St
- 2638 S Lemon Place
- 2644 S Euclid Ave
- 218 E Hazeltine St
- 103 W Blue Jay Way
- 208 E Blue Jay Way