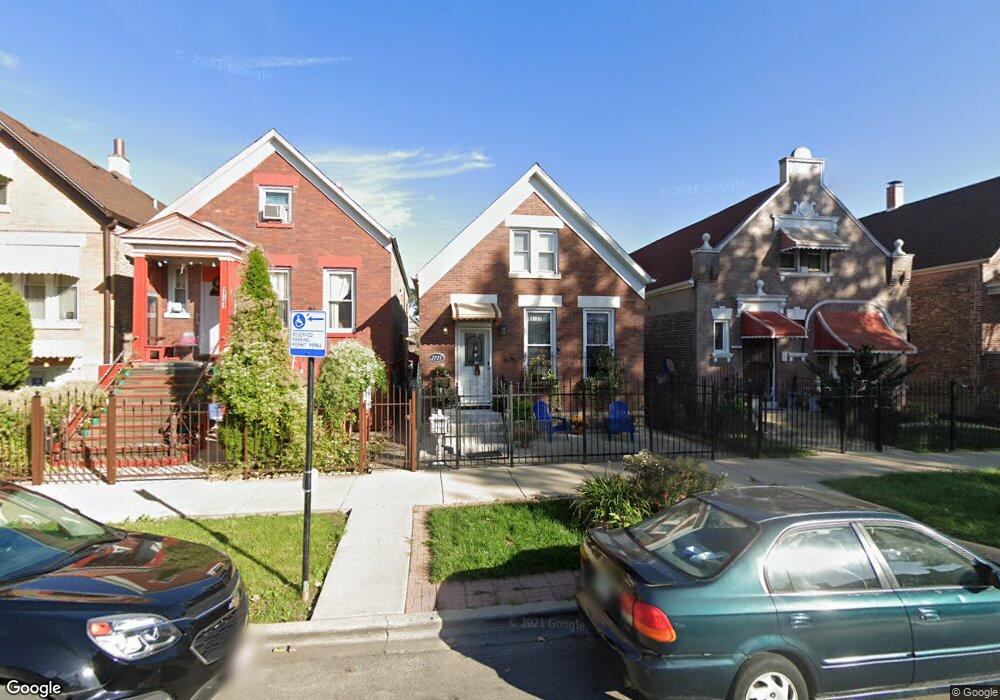
2723 S Hamlin Ave Chicago, IL 60623
Little Village NeighborhoodEstimated Value: $192,895 - $257,000
3
Beds
2
Baths
1,140
Sq Ft
$205/Sq Ft
Est. Value
About This Home
This home is located at 2723 S Hamlin Ave, Chicago, IL 60623 and is currently estimated at $233,724, approximately $205 per square foot. 2723 S Hamlin Ave is a home located in Cook County with nearby schools including Gary Elementary School, Ortiz De Dominguez Elementary School, and St. Agnes of Bohemia School.
Ownership History
Date
Name
Owned For
Owner Type
Purchase Details
Closed on
Nov 23, 2020
Sold by
Arroyo Gustavo
Bought by
Arroyo Kirim A and Giron Kirim A
Current Estimated Value
Purchase Details
Closed on
Jul 24, 2009
Sold by
Hsbc Bank Usa National Association
Bought by
Arroyo Gustavo and Arroyo Kirim
Purchase Details
Closed on
Oct 2, 2008
Sold by
Ramirez
Bought by
Hsbc Bank Usa Na
Purchase Details
Closed on
Oct 29, 2002
Sold by
Martinez J Luz and Martinez Ma Del Carmen
Bought by
Ramirez Tadeo and Ramirez Araceli
Home Financials for this Owner
Home Financials are based on the most recent Mortgage that was taken out on this home.
Original Mortgage
$131,100
Interest Rate
7.74%
Purchase Details
Closed on
Jan 31, 1997
Sold by
Martinez J Luz and Martinez Ma Delcarmen
Bought by
Martinez J Luz and Martinez Ma Delcarmen
Create a Home Valuation Report for This Property
The Home Valuation Report is an in-depth analysis detailing your home's value as well as a comparison with similar homes in the area
Home Values in the Area
Average Home Value in this Area
Purchase History
| Date | Buyer | Sale Price | Title Company |
|---|---|---|---|
| Arroyo Kirim A | -- | Chicago Title | |
| Arroyo Gustavo | $21,000 | First American Title | |
| Hsbc Bank Usa Na | -- | None Available | |
| Ramirez Tadeo | $138,000 | Multiple | |
| Martinez J Luz | -- | -- |
Source: Public Records
Mortgage History
| Date | Status | Borrower | Loan Amount |
|---|---|---|---|
| Previous Owner | Ramirez Tadeo | $131,100 |
Source: Public Records
Tax History
| Year | Tax Paid | Tax Assessment Tax Assessment Total Assessment is a certain percentage of the fair market value that is determined by local assessors to be the total taxable value of land and additions on the property. | Land | Improvement |
|---|---|---|---|---|
| 2025 | $988 | $19,600 | $4,350 | $15,250 |
| 2024 | $988 | $19,600 | $4,350 | $15,250 |
| 2023 | $942 | $8,000 | $3,525 | $4,475 |
| 2022 | $942 | $8,000 | $3,525 | $4,475 |
| 2021 | $939 | $8,000 | $3,525 | $4,475 |
| 2020 | $2,144 | $12,725 | $3,525 | $9,200 |
| 2019 | $2,216 | $14,461 | $3,525 | $10,936 |
| 2018 | $2,178 | $14,461 | $3,525 | $10,936 |
| 2017 | $2,398 | $14,516 | $3,150 | $11,366 |
| 2016 | $2,407 | $14,516 | $3,150 | $11,366 |
| 2015 | $2,179 | $14,516 | $3,150 | $11,366 |
| 2014 | $1,890 | $12,755 | $3,000 | $9,755 |
| 2013 | $1,842 | $12,755 | $3,000 | $9,755 |
Source: Public Records
Map
Nearby Homes
- 2741 S Avers Ave
- 2807 S Hamlin Ave
- 2541 S Springfield Ave
- 2847 S Harding Ave
- 2854 S Central Park Ave
- 1808 S Hamlin Ave
- 2527 S Harding Ave
- 3031 S Central Park Ave
- 2433 S Harding Ave
- 2724 S Karlov Ave
- 2728 S Karlov Ave
- 2752 S Sacramento Ave
- 2407 S Lawndale Ave
- 3026 S Saint Louis Ave
- 2436 S Pulaski Rd
- 2352 S Lawndale Ave
- 2107 S Harding Ave
- 3022 S Homan Ave
- 2417 S Saint Louis Ave
- 2453 S Trumbull Ave
- 2721 S Hamlin Ave
- 2725 S Hamlin Ave
- 2719 S Hamlin Ave
- 2729 S Hamlin Ave
- 2717 S Hamlin Ave
- 2731 S Hamlin Ave Unit 1
- 2715 S Hamlin Ave
- 2735 S Hamlin Ave
- 2720 S Ridgeway Ave
- 2728 S Ridgeway Ave
- 2716 S Ridgeway Ave
- 2730 S Ridgeway Ave
- 2718 S Hamlin Ave
- 2714 S Ridgeway Ave
- 2739 S Hamlin Ave
- 2716 S Hamlin Ave
- 2724 S Ridgeway Ave
- 2724 S Ridgeway Ave
- 2732 S Ridgeway Ave
- 2707 S Hamlin Ave
Your Personal Tour Guide
Ask me questions while you tour the home.