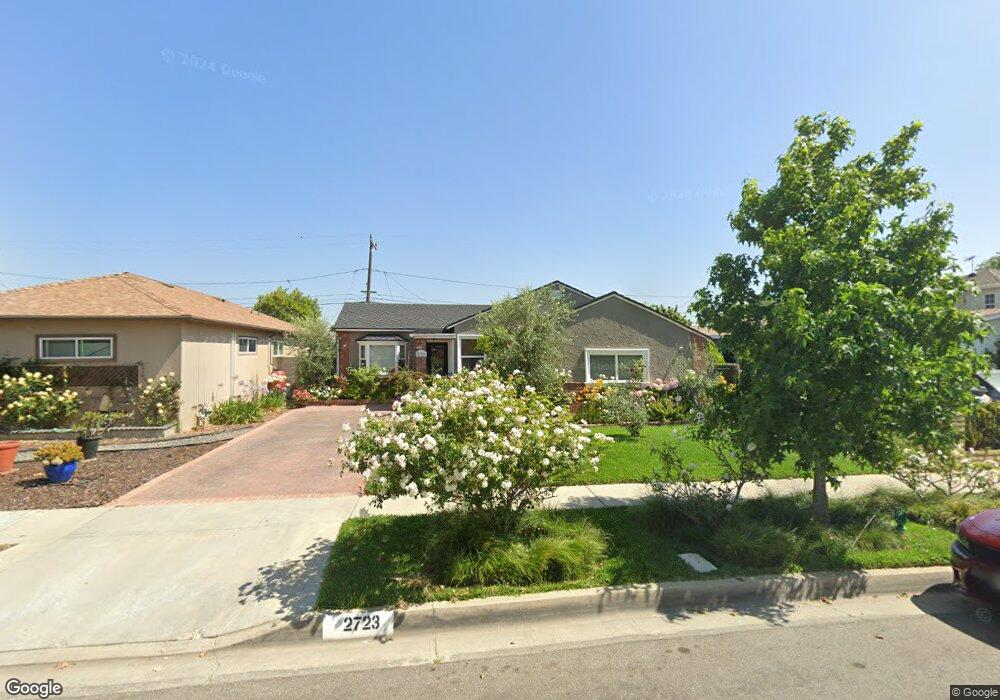
2723 W 145th St Gardena, CA 90249
Estimated Value: $691,000 - $912,000
3
Beds
1
Bath
1,013
Sq Ft
$761/Sq Ft
Est. Value
About This Home
This home is located at 2723 W 145th St, Gardena, CA 90249 and is currently estimated at $771,110, approximately $761 per square foot. 2723 W 145th St is a home located in Los Angeles County with nearby schools including Chapman Elementary School, Robert E. Peary Middle School, and Gardena Senior High School.
Ownership History
Date
Name
Owned For
Owner Type
Purchase Details
Closed on
Oct 2, 1998
Sold by
Federal National Mortgage Association
Bought by
Lemus Nicolas R and Lemus Ana Maria
Current Estimated Value
Home Financials for this Owner
Home Financials are based on the most recent Mortgage that was taken out on this home.
Original Mortgage
$147,300
Outstanding Balance
$31,722
Interest Rate
6.71%
Mortgage Type
Seller Take Back
Estimated Equity
$739,388
Purchase Details
Closed on
Jun 24, 1998
Sold by
Garcia Juan Sanchez and Moreno Silvia
Bought by
Federal National Mortgage Association
Purchase Details
Closed on
Feb 12, 1997
Sold by
Zuniga Joe T
Bought by
Garcia Juan Sanchez and Moreno Silvia
Home Financials for this Owner
Home Financials are based on the most recent Mortgage that was taken out on this home.
Original Mortgage
$144,500
Interest Rate
7.96%
Create a Home Valuation Report for This Property
The Home Valuation Report is an in-depth analysis detailing your home's value as well as a comparison with similar homes in the area
Home Values in the Area
Average Home Value in this Area
Purchase History
| Date | Buyer | Sale Price | Title Company |
|---|---|---|---|
| Lemus Nicolas R | $152,000 | First American Title Co | |
| Federal National Mortgage Association | $149,000 | First Southwestern Title Co | |
| Garcia Juan Sanchez | $149,000 | -- |
Source: Public Records
Mortgage History
| Date | Status | Borrower | Loan Amount |
|---|---|---|---|
| Open | Lemus Nicolas R | $147,300 | |
| Previous Owner | Garcia Juan Sanchez | $144,500 |
Source: Public Records
Tax History Compared to Growth
Tax History
| Year | Tax Paid | Tax Assessment Tax Assessment Total Assessment is a certain percentage of the fair market value that is determined by local assessors to be the total taxable value of land and additions on the property. | Land | Improvement |
|---|---|---|---|---|
| 2025 | $3,193 | $238,264 | $177,608 | $60,656 |
| 2024 | $3,193 | $233,593 | $174,126 | $59,467 |
| 2023 | $3,137 | $229,013 | $170,712 | $58,301 |
| 2022 | $2,986 | $224,523 | $167,365 | $57,158 |
| 2021 | $2,953 | $220,122 | $164,084 | $56,038 |
| 2019 | $2,860 | $213,595 | $159,218 | $54,377 |
| 2018 | $2,780 | $209,408 | $156,097 | $53,311 |
| 2016 | $2,661 | $201,279 | $150,037 | $51,242 |
| 2015 | $2,617 | $198,257 | $147,784 | $50,473 |
| 2014 | $2,620 | $194,375 | $144,890 | $49,485 |
Source: Public Records
Map
Nearby Homes
- 2817 W 146th St
- 14835 Wadkins Ave
- 2917 W Rosecrans Ave
- 14815 Crenshaw Blvd
- 14526 Chadron Ave
- 14324 Chadron Ave
- 3129 Marine Ave Unit 7
- 14026 Lemoli Ave Unit C
- 3245 Marine Ave
- 2179 Bluewing Walk
- 14050 Lemoli Way
- 13945 Lemoli Ave
- 14710 Parron Ave
- 15322 Casimir Ave
- 2018 W 147th St
- 13621 Arcturus Ave
- 13717 Chadron Ave
- 14000 Cerise Ave
- 14012 Cerise Ave Unit 3
- 14540 Yukon Ave
- 2717 W 145th St
- 2727 W 145th St
- 2713 W 145th St
- 2803 W 145th St
- 2722 W 144th St
- 2718 W 144th St
- 2728 W 144th St
- 2712 W 144th St
- 2707 W 145th St
- 2807 W 145th St
- 2722 W 145th St
- 2802 W 144th St
- 2716 W 145th St
- 2726 W 145th St
- 2708 W 144th St
- 2802 W 145th St
- 2712 W 145th St
- 2703 W 145th St
- 2813 W 145th St
- 2806 W 144th St