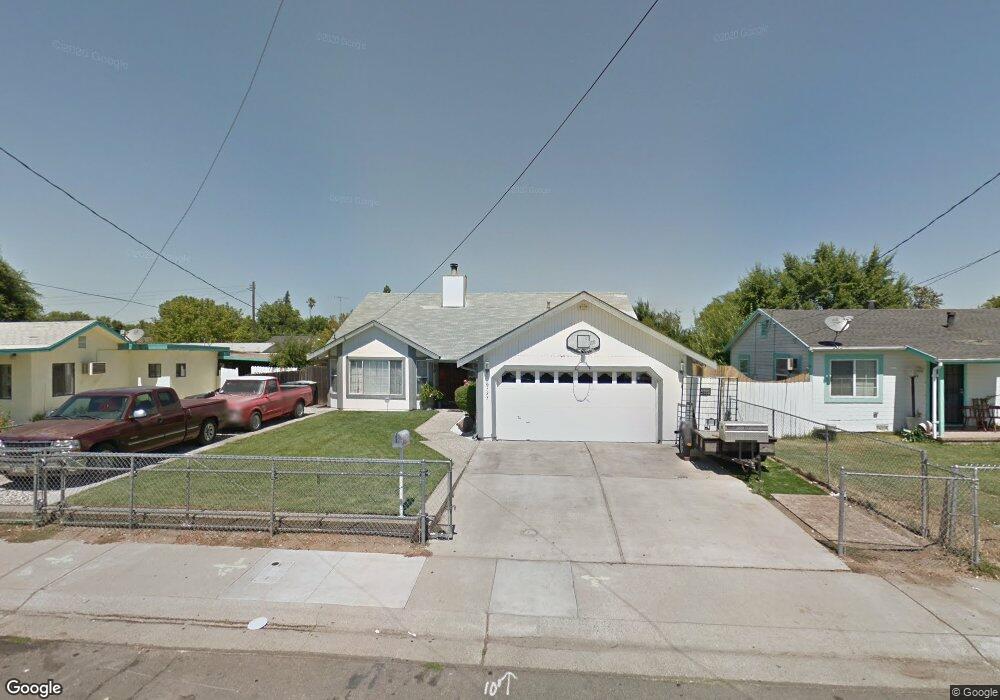
2723 Yreka Ave Sacramento, CA 95822
Woodbine NeighborhoodEstimated Value: $316,000 - $512,000
4
Beds
2
Baths
1,854
Sq Ft
$243/Sq Ft
Est. Value
About This Home
This home is located at 2723 Yreka Ave, Sacramento, CA 95822 and is currently estimated at $450,806, approximately $243 per square foot. 2723 Yreka Ave is a home located in Sacramento County with nearby schools including Woodbine Elementary School, Rosa Parks Elementary School, and Luther Burbank High School.
Ownership History
Date
Name
Owned For
Owner Type
Purchase Details
Closed on
Jul 7, 2003
Sold by
Maqbool Mohammed J K and Maqbool Jessica L
Bought by
Razo Roberto and Razo Ana
Current Estimated Value
Home Financials for this Owner
Home Financials are based on the most recent Mortgage that was taken out on this home.
Original Mortgage
$180,000
Outstanding Balance
$76,296
Interest Rate
5.22%
Mortgage Type
Purchase Money Mortgage
Estimated Equity
$374,510
Purchase Details
Closed on
Dec 30, 1998
Sold by
Sahib Sheik Galib and Sahib Sham
Bought by
Magbool Mohammed J K and Magbool Jessica L
Home Financials for this Owner
Home Financials are based on the most recent Mortgage that was taken out on this home.
Original Mortgage
$99,358
Interest Rate
6.66%
Mortgage Type
FHA
Purchase Details
Closed on
Jun 9, 1994
Sold by
Kaplan Douglas A
Bought by
Sahib Sheik Galib and Sahib Shamshad
Create a Home Valuation Report for This Property
The Home Valuation Report is an in-depth analysis detailing your home's value as well as a comparison with similar homes in the area
Home Values in the Area
Average Home Value in this Area
Purchase History
| Date | Buyer | Sale Price | Title Company |
|---|---|---|---|
| Razo Roberto | $230,000 | Financial Title Company | |
| Magbool Mohammed J K | $100,000 | Financial Title Company | |
| Sahib Sheik Galib | $137,500 | Founders Title Company |
Source: Public Records
Mortgage History
| Date | Status | Borrower | Loan Amount |
|---|---|---|---|
| Open | Razo Roberto | $180,000 | |
| Previous Owner | Magbool Mohammed J K | $99,358 |
Source: Public Records
Tax History Compared to Growth
Tax History
| Year | Tax Paid | Tax Assessment Tax Assessment Total Assessment is a certain percentage of the fair market value that is determined by local assessors to be the total taxable value of land and additions on the property. | Land | Improvement |
|---|---|---|---|---|
| 2025 | $5,806 | $326,992 | $49,752 | $277,240 |
| 2024 | $5,806 | $320,581 | $48,777 | $271,804 |
| 2023 | $6,243 | $314,296 | $47,821 | $266,475 |
| 2022 | $5,442 | $308,134 | $46,884 | $261,250 |
| 2021 | $5,606 | $302,093 | $45,965 | $256,128 |
| 2020 | $5,670 | $298,996 | $45,494 | $253,502 |
| 2019 | $5,702 | $293,134 | $44,602 | $248,532 |
| 2018 | $4,407 | $287,387 | $43,728 | $243,659 |
| 2017 | $4,335 | $281,753 | $42,871 | $238,882 |
| 2016 | $5,150 | $255,335 | $38,851 | $216,484 |
| 2015 | $4,793 | $223,979 | $34,080 | $189,899 |
| 2014 | $4,745 | $213,313 | $32,457 | $180,856 |
Source: Public Records
Map
Nearby Homes
- 2481 Wah Ave
- 2475 Wah Ave
- 2469 Wah Ave
- 2463 Wah Ave
- 2835 Hing Ave
- 6915 Sundown Dr
- 59 Quasar Cir
- 6887 N Tranquility Dr
- 7066 Tranquility Dr
- 87 Pulsar Cir
- 6815 24th St
- 6983 Pleasure Ln
- 2429 50th Ave
- 7036 Remo Way
- 7273 Luther Dr
- 2681 Meadowvale Ave
- 2324 Mangrum Ave
- 95 Bentley Ave
- 3635 51st Ave
- 2121 Aaron Way