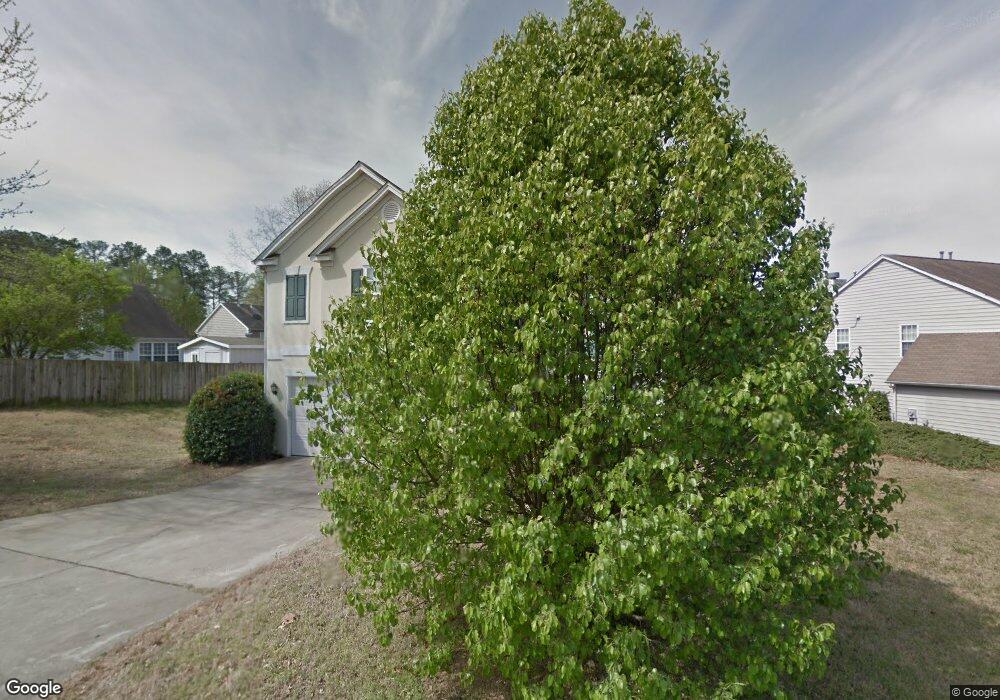
2724 Chelwick Dr SW Marietta, GA 30008
Southwestern Marietta NeighborhoodEstimated Value: $376,160 - $412,000
3
Beds
3
Baths
2,064
Sq Ft
$189/Sq Ft
Est. Value
About This Home
This home is located at 2724 Chelwick Dr SW, Marietta, GA 30008 and is currently estimated at $389,290, approximately $188 per square foot. 2724 Chelwick Dr SW is a home located in Cobb County with nearby schools including Birney Elementary School, Smitha Middle School, and Osborne High School.
Ownership History
Date
Name
Owned For
Owner Type
Purchase Details
Closed on
Sep 25, 2009
Sold by
Federal Natl Mtg Assoc
Bought by
Ross Michael
Current Estimated Value
Home Financials for this Owner
Home Financials are based on the most recent Mortgage that was taken out on this home.
Original Mortgage
$104,000
Outstanding Balance
$68,119
Interest Rate
5.22%
Mortgage Type
New Conventional
Estimated Equity
$321,171
Purchase Details
Closed on
Jul 7, 2009
Sold by
Aurora Loan Services Llc
Bought by
Federal Natl Mtg Assoc
Purchase Details
Closed on
Nov 20, 2000
Sold by
Milleville Barbara J
Bought by
Ventura Santos
Home Financials for this Owner
Home Financials are based on the most recent Mortgage that was taken out on this home.
Original Mortgage
$120,800
Interest Rate
7.75%
Mortgage Type
New Conventional
Purchase Details
Closed on
Sep 5, 1997
Sold by
Centex Homes
Bought by
Milleville Barbara J
Home Financials for this Owner
Home Financials are based on the most recent Mortgage that was taken out on this home.
Original Mortgage
$119,300
Interest Rate
7.39%
Mortgage Type
New Conventional
Create a Home Valuation Report for This Property
The Home Valuation Report is an in-depth analysis detailing your home's value as well as a comparison with similar homes in the area
Home Values in the Area
Average Home Value in this Area
Purchase History
| Date | Buyer | Sale Price | Title Company |
|---|---|---|---|
| Ross Michael | $130,000 | -- | |
| Federal Natl Mtg Assoc | -- | -- | |
| Aurora Loan Services Llc | $151,809 | -- | |
| Ventura Santos | $151,000 | -- | |
| Milleville Barbara J | $132,600 | -- |
Source: Public Records
Mortgage History
| Date | Status | Borrower | Loan Amount |
|---|---|---|---|
| Open | Ross Michael | $104,000 | |
| Previous Owner | Ventura Santos | $120,800 | |
| Previous Owner | Milleville Barbara J | $119,300 |
Source: Public Records
Tax History Compared to Growth
Tax History
| Year | Tax Paid | Tax Assessment Tax Assessment Total Assessment is a certain percentage of the fair market value that is determined by local assessors to be the total taxable value of land and additions on the property. | Land | Improvement |
|---|---|---|---|---|
| 2025 | $3,553 | $150,588 | $30,000 | $120,588 |
| 2024 | $3,556 | $150,588 | $30,000 | $120,588 |
| 2023 | $2,392 | $121,944 | $13,600 | $108,344 |
| 2022 | $2,957 | $121,944 | $13,600 | $108,344 |
| 2021 | $2,142 | $84,724 | $13,600 | $71,124 |
| 2020 | $2,142 | $84,724 | $13,600 | $71,124 |
| 2019 | $1,874 | $72,452 | $12,000 | $60,452 |
| 2018 | $1,874 | $72,452 | $12,000 | $60,452 |
| 2017 | $1,543 | $62,604 | $12,000 | $50,604 |
| 2016 | $1,544 | $62,604 | $12,000 | $50,604 |
| 2015 | $1,331 | $54,028 | $16,000 | $38,028 |
| 2014 | $1,343 | $54,028 | $0 | $0 |
Source: Public Records
Map
Nearby Homes
- 1308 Willamette Way
- 1086 Mornington Way
- 2964 Edgemont Ln SW
- 1345 Windage Ct SW Unit 6
- 3075 Milford Chase SW
- 2907 Crest Ridge Ct SW
- 3004 Michael Dr SW
- 2615 Windage Dr SW
- 1104 Havel Dr SW
- 1105 Woodleigh Rd SW
- 1020 Hicksmil Dr SW
- 2940 Caller Ct SW
- 1108 Byers Dr SW
- 1427 Lost Bridge Rd
- 3123 Milford Chase SW
- 959 Old Milford Church Rd SW
- 881 Whittington Pkwy
- 0 Chelwick Dr SW Unit 8590247
- 0 Chelwick Dr SW
- 2720 Chelwick Dr SW
- 1274 Everwood Dr SW
- 1272 Everwood Dr SW
- 2783 Chelwick Ct SW
- 1276 Everwood Dr SW
- 2725 Chelwick Dr SW Unit 1
- 2727 Chelwick Dr SW
- 2727 Chelwick Dr SW Unit 1
- 2781 Chelwick Ct SW
- 2721 Chelwick Dr SW Unit 1
- 2723 Chelwick Dr SW
- 2785 Chelwick Ct SW
- 1278 Everwood Dr SW
- 1268 Everwood Dr SW
- 2719 Chelwick Dr SW
- 1264 Everwood Dr SW Unit 2
- 1280 Everwood Dr SW Unit 1
- 2717 Chelwick Dr SW