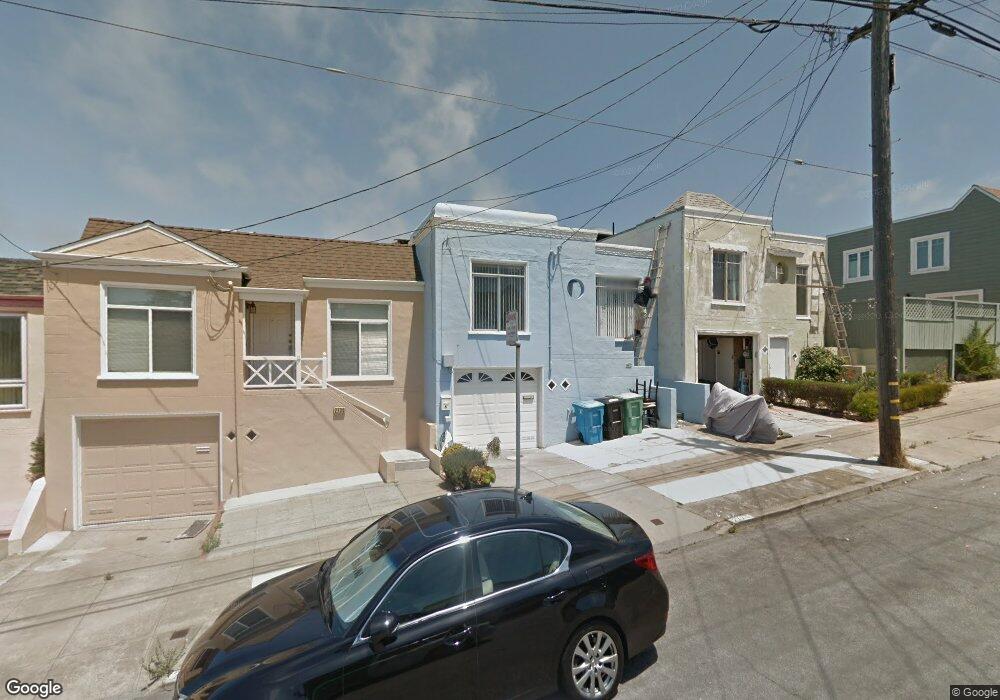
2724 Pacheco St San Francisco, CA 94116
Parkside NeighborhoodEstimated Value: $1,111,000 - $1,295,000
2
Beds
1
Bath
800
Sq Ft
$1,500/Sq Ft
Est. Value
About This Home
This home is located at 2724 Pacheco St, San Francisco, CA 94116 and is currently estimated at $1,200,378, approximately $1,500 per square foot. 2724 Pacheco St is a home located in San Francisco County with nearby schools including Stevenson (Robert Louis) Elementary School, Giannini (A.P.) Middle School, and Cornerstone Academy-Lawton Campus.
Ownership History
Date
Name
Owned For
Owner Type
Purchase Details
Closed on
Apr 28, 2006
Sold by
Mack Delvin O
Bought by
Tong Tram
Current Estimated Value
Home Financials for this Owner
Home Financials are based on the most recent Mortgage that was taken out on this home.
Original Mortgage
$576,000
Outstanding Balance
$337,775
Interest Rate
6.62%
Mortgage Type
New Conventional
Estimated Equity
$862,603
Create a Home Valuation Report for This Property
The Home Valuation Report is an in-depth analysis detailing your home's value as well as a comparison with similar homes in the area
Home Values in the Area
Average Home Value in this Area
Purchase History
| Date | Buyer | Sale Price | Title Company |
|---|---|---|---|
| Tong Tram | $720,000 | Alliance Title Company |
Source: Public Records
Mortgage History
| Date | Status | Borrower | Loan Amount |
|---|---|---|---|
| Open | Tong Tram | $576,000 |
Source: Public Records
Tax History Compared to Growth
Tax History
| Year | Tax Paid | Tax Assessment Tax Assessment Total Assessment is a certain percentage of the fair market value that is determined by local assessors to be the total taxable value of land and additions on the property. | Land | Improvement |
|---|---|---|---|---|
| 2025 | $12,007 | $983,920 | $590,355 | $393,565 |
| 2024 | $12,007 | $964,629 | $578,780 | $385,849 |
| 2023 | $11,821 | $945,716 | $567,432 | $378,284 |
| 2022 | $11,588 | $927,173 | $556,306 | $370,867 |
| 2021 | $11,380 | $908,995 | $545,399 | $363,596 |
| 2020 | $11,439 | $899,675 | $539,807 | $359,868 |
| 2019 | $11,047 | $882,035 | $529,223 | $352,812 |
| 2018 | $10,674 | $864,742 | $518,847 | $345,895 |
| 2017 | $10,248 | $847,787 | $508,674 | $339,113 |
| 2016 | $10,288 | $820,000 | $492,000 | $328,000 |
| 2015 | $9,935 | $740,000 | $481,000 | $259,000 |
| 2014 | $8,285 | $665,000 | $399,000 | $266,000 |
Source: Public Records
Map
Nearby Homes