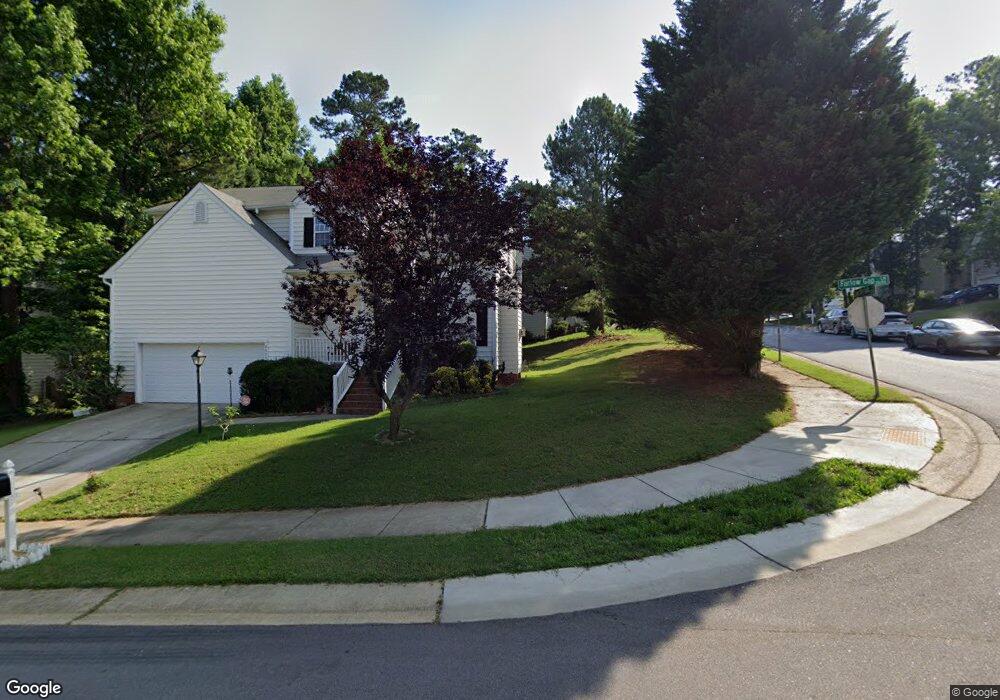
2724 Upper Dry Falls Ct Raleigh, NC 27603
South Raleigh NeighborhoodEstimated Value: $442,000 - $462,731
3
Beds
3
Baths
1,882
Sq Ft
$239/Sq Ft
Est. Value
About This Home
This home is located at 2724 Upper Dry Falls Ct, Raleigh, NC 27603 and is currently estimated at $448,933, approximately $238 per square foot. 2724 Upper Dry Falls Ct is a home located in Wake County with nearby schools including Dillard Drive Magnet Elementary School, Dillard Drive Magnet Middle School, and Longleaf School Of The Arts.
Ownership History
Date
Name
Owned For
Owner Type
Purchase Details
Closed on
Sep 18, 2012
Sold by
Nifong Timothy J and Nifong Katie Self
Bought by
Hall Jeffrey R
Current Estimated Value
Home Financials for this Owner
Home Financials are based on the most recent Mortgage that was taken out on this home.
Original Mortgage
$218,000
Outstanding Balance
$155,593
Interest Rate
4.25%
Mortgage Type
New Conventional
Estimated Equity
$293,340
Purchase Details
Closed on
Sep 12, 2007
Sold by
Meares Matthew A and Meares Robin F
Bought by
Nifong Timothy J
Home Financials for this Owner
Home Financials are based on the most recent Mortgage that was taken out on this home.
Original Mortgage
$147,000
Interest Rate
6.62%
Mortgage Type
Negative Amortization
Purchase Details
Closed on
Mar 28, 2002
Sold by
Horizon Homes Inc
Bought by
Meares Matthew A and Meares Robin F
Home Financials for this Owner
Home Financials are based on the most recent Mortgage that was taken out on this home.
Original Mortgage
$128,100
Interest Rate
6.85%
Create a Home Valuation Report for This Property
The Home Valuation Report is an in-depth analysis detailing your home's value as well as a comparison with similar homes in the area
Home Values in the Area
Average Home Value in this Area
Purchase History
| Date | Buyer | Sale Price | Title Company |
|---|---|---|---|
| Hall Jeffrey R | $218,000 | None Available | |
| Nifong Timothy J | $210,000 | None Available | |
| Meares Matthew A | $160,500 | -- |
Source: Public Records
Mortgage History
| Date | Status | Borrower | Loan Amount |
|---|---|---|---|
| Open | Hall Jeffrey R | $218,000 | |
| Previous Owner | Nifong Timothy J | $147,000 | |
| Previous Owner | Meares Matthew A | $128,100 | |
| Closed | Meares Matthew A | $24,020 |
Source: Public Records
Tax History Compared to Growth
Tax History
| Year | Tax Paid | Tax Assessment Tax Assessment Total Assessment is a certain percentage of the fair market value that is determined by local assessors to be the total taxable value of land and additions on the property. | Land | Improvement |
|---|---|---|---|---|
| 2025 | $3,906 | $445,542 | $160,000 | $285,542 |
| 2024 | $3,890 | $445,542 | $160,000 | $285,542 |
| 2023 | $3,281 | $299,145 | $60,000 | $239,145 |
| 2022 | $3,049 | $299,145 | $60,000 | $239,145 |
| 2021 | $2,931 | $299,145 | $60,000 | $239,145 |
| 2020 | $2,877 | $299,145 | $60,000 | $239,145 |
| 2019 | $2,523 | $216,008 | $54,000 | $162,008 |
| 2018 | $2,380 | $216,008 | $54,000 | $162,008 |
| 2017 | $2,267 | $216,008 | $54,000 | $162,008 |
| 2016 | $2,221 | $216,008 | $54,000 | $162,008 |
| 2015 | $2,209 | $211,385 | $48,000 | $163,385 |
| 2014 | $2,095 | $211,385 | $48,000 | $163,385 |
Source: Public Records
Map
Nearby Homes
- 2816 Alder Ridge Ln
- 2901 Alder Ridge Ln
- 2639 Broad Oaks Place Unit 21
- 2505 Ferndown Ct
- 2607 Sterling Park Dr
- 2636 Scattered Oak Ct
- 3113 Henslowe Dr
- 2524 Ferndown Ct
- 2528 Beech Gap Ct
- 2201 Mountain Mist Ct Unit 103
- 2221 Mountain Mist Ct Unit 201
- 2621 Ivory Run Way Unit 105
- 2271 Trailwood Valley Cir
- 2831 Barrymore St Unit 107
- 2220 Hoot Owl Ct
- 2228 Trailwood Valley Cir
- 2920 Barrymore St Unit 106
- 1901 Trailwood Heights Ln Unit 304
- 2108 Leadenhall Way
- 3109 Tryon Rd
- 2720 Upper Dry Falls Ct
- 2605 Farlow Gap Ln
- 2709 Alder Ridge Ln
- 2705 Alder Ridge Ln
- 2601 Farlow Gap Ln
- 2716 Upper Dry Falls Ct
- 2701 Alder Ridge Ln
- 2725 Upper Dry Falls Ct
- 2721 Upper Dry Falls Ct
- 2617 Farlow Gap Ln
- 2621 Alder Ridge Ln
- 2712 Upper Dry Falls Ct
- 2717 Upper Dry Falls Ct
- 2604 Farlow Gap Ln
- 2617 Alder Ridge Ln
- 2800 Lower Dry Falls Ct
- 2521 Farlow Gap Ln
- 2708 Alder Ridge Ln
- 2800 Lower Dryer Falls Ct
- 2621 Farlow Gap Ln