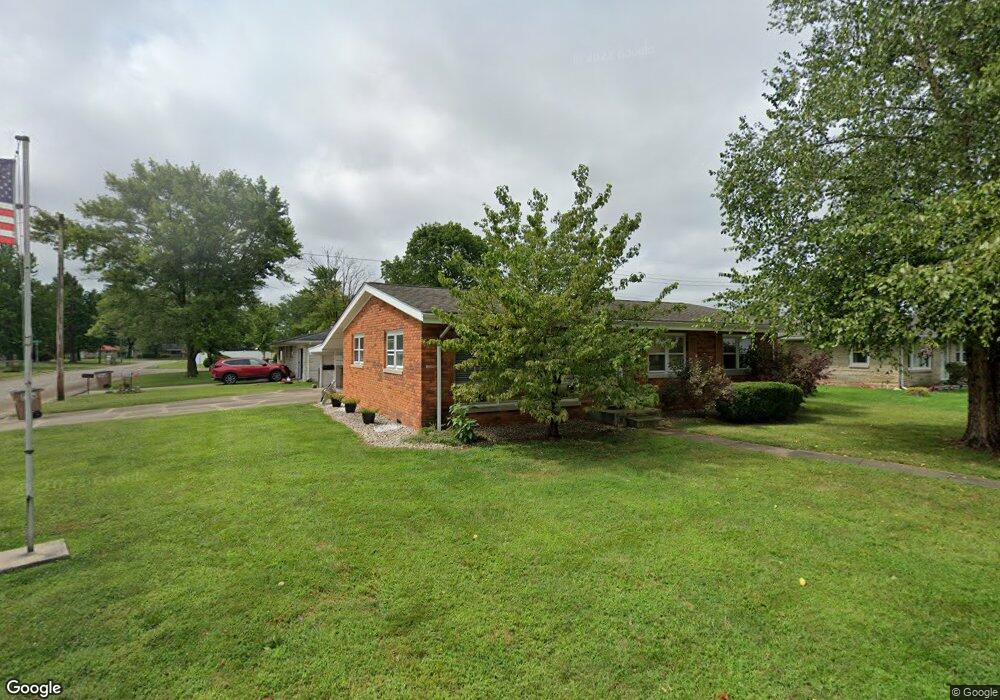
2725 16th St Columbus, IN 47201
Estimated Value: $199,194 - $226,000
3
Beds
2
Baths
1,302
Sq Ft
$161/Sq Ft
Est. Value
About This Home
This home is located at 2725 16th St, Columbus, IN 47201 and is currently estimated at $210,049, approximately $161 per square foot. 2725 16th St is a home located in Bartholomew County with nearby schools including L.F. Smith Elementary School, Central Middle School, and Columbus East High School.
Ownership History
Date
Name
Owned For
Owner Type
Purchase Details
Closed on
Dec 12, 2011
Sold by
Robertson David A and Robertson Julie M
Bought by
Lowry Glen
Current Estimated Value
Purchase Details
Closed on
Feb 3, 2005
Sold by
Watkins Bobby Joe
Bought by
Robertson David A and Robertson Julie M
Purchase Details
Closed on
Jun 9, 2004
Sold by
Lee Anderson David
Bought by
Chance D C
Purchase Details
Closed on
Nov 18, 2002
Sold by
Anderson Tamaria J
Bought by
Anderson David Lee
Create a Home Valuation Report for This Property
The Home Valuation Report is an in-depth analysis detailing your home's value as well as a comparison with similar homes in the area
Home Values in the Area
Average Home Value in this Area
Purchase History
| Date | Buyer | Sale Price | Title Company |
|---|---|---|---|
| Lowry Glen | $110,000 | Land America Lawyers Title | |
| Lowry Glen | $110,000 | -- | |
| Robertson David A | -- | Progressive Land Title | |
| Chance D C | $45,159 | -- | |
| Anderson David Lee | -- | -- |
Source: Public Records
Tax History Compared to Growth
Tax History
| Year | Tax Paid | Tax Assessment Tax Assessment Total Assessment is a certain percentage of the fair market value that is determined by local assessors to be the total taxable value of land and additions on the property. | Land | Improvement |
|---|---|---|---|---|
| 2024 | $1,327 | $131,500 | $27,400 | $104,100 |
| 2023 | $1,079 | $116,200 | $27,400 | $88,800 |
| 2022 | $1,148 | $117,100 | $27,400 | $89,700 |
| 2021 | $998 | $107,000 | $19,800 | $87,200 |
| 2020 | $902 | $100,100 | $19,800 | $80,300 |
| 2019 | $844 | $100,100 | $19,800 | $80,300 |
| 2018 | $777 | $96,400 | $19,800 | $76,600 |
| 2017 | $745 | $94,100 | $18,000 | $76,100 |
| 2016 | $680 | $91,100 | $18,000 | $73,100 |
| 2014 | $782 | $96,200 | $18,000 | $78,200 |
Source: Public Records
Map
Nearby Homes