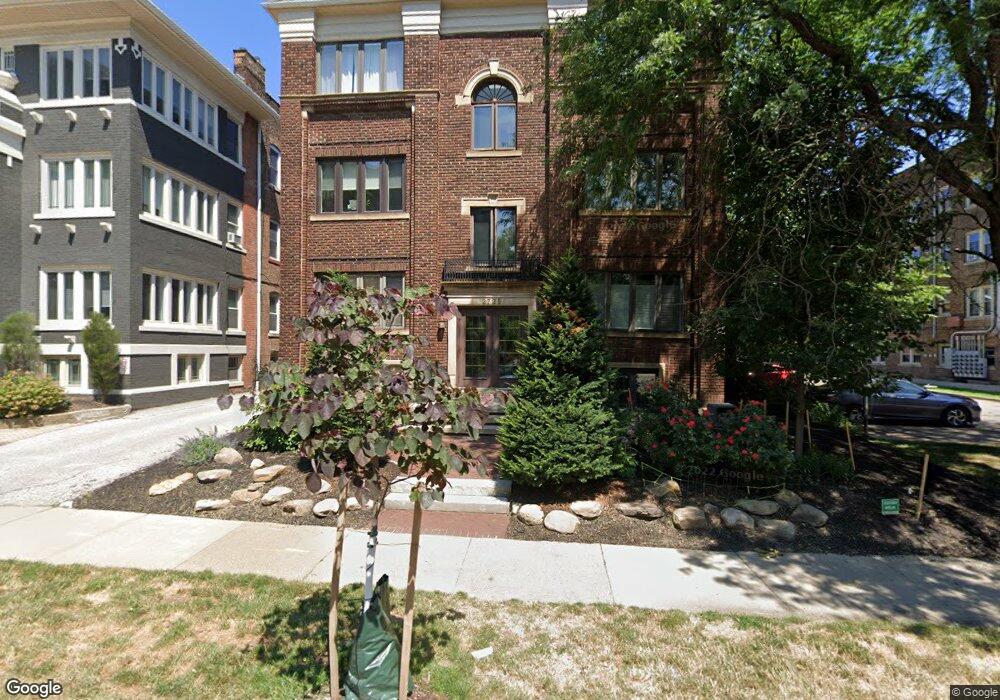
2725 Hampshire Rd Cleveland, OH 44106
Estimated Value: $163,000 - $200,000
2
Beds
1
Bath
1,197
Sq Ft
$149/Sq Ft
Est. Value
About This Home
This home is located at 2725 Hampshire Rd, Cleveland, OH 44106 and is currently estimated at $178,717, approximately $149 per square foot. 2725 Hampshire Rd is a home located in Cuyahoga County with nearby schools including Roxboro Elementary School, Roxboro Middle School, and Cleveland Heights High School.
Ownership History
Date
Name
Owned For
Owner Type
Purchase Details
Closed on
Jun 22, 2021
Sold by
Du Jerry Y
Bought by
Weisman Mark
Current Estimated Value
Purchase Details
Closed on
May 12, 2017
Sold by
Prater Rebecca
Bought by
Du Jerry Yi
Home Financials for this Owner
Home Financials are based on the most recent Mortgage that was taken out on this home.
Original Mortgage
$92,000
Interest Rate
4.14%
Mortgage Type
New Conventional
Purchase Details
Closed on
Jan 15, 2015
Sold by
Fannie Mae
Bought by
Prater Rebecca
Purchase Details
Closed on
Dec 4, 2013
Sold by
Cheistwer Ian
Bought by
Federal National Mortgage Association
Purchase Details
Closed on
Oct 30, 2007
Sold by
2725 Hampshire Road Condominiums Llc
Bought by
Cheistwer Ian
Home Financials for this Owner
Home Financials are based on the most recent Mortgage that was taken out on this home.
Original Mortgage
$139,500
Interest Rate
6.38%
Mortgage Type
Purchase Money Mortgage
Create a Home Valuation Report for This Property
The Home Valuation Report is an in-depth analysis detailing your home's value as well as a comparison with similar homes in the area
Home Values in the Area
Average Home Value in this Area
Purchase History
| Date | Buyer | Sale Price | Title Company |
|---|---|---|---|
| Weisman Mark | $145,000 | Ohio Real Title | |
| Du Jerry Yi | $115,000 | Ace Title | |
| Prater Rebecca | -- | Allodial Title Llc | |
| Federal National Mortgage Association | -- | Service Link | |
| Cheistwer Ian | $155,000 | Ohio Title Corp |
Source: Public Records
Mortgage History
| Date | Status | Borrower | Loan Amount |
|---|---|---|---|
| Previous Owner | Du Jerry Yi | $92,000 | |
| Previous Owner | Cheistwer Ian | $139,500 |
Source: Public Records
Tax History Compared to Growth
Tax History
| Year | Tax Paid | Tax Assessment Tax Assessment Total Assessment is a certain percentage of the fair market value that is determined by local assessors to be the total taxable value of land and additions on the property. | Land | Improvement |
|---|---|---|---|---|
| 2024 | $4,248 | $50,750 | $5,320 | $45,430 |
| 2023 | $4,611 | $43,060 | $4,310 | $38,750 |
| 2022 | $4,588 | $43,050 | $4,305 | $38,745 |
| 2021 | $4,493 | $43,050 | $4,310 | $38,750 |
| 2020 | $4,646 | $40,250 | $4,030 | $36,230 |
| 2019 | $4,385 | $115,000 | $11,500 | $103,500 |
| 2018 | $4,387 | $40,250 | $4,030 | $36,230 |
| 2017 | $6,218 | $51,910 | $4,410 | $47,500 |
| 2016 | $6,207 | $51,910 | $4,410 | $47,500 |
| 2015 | $5,887 | $51,910 | $4,410 | $47,500 |
| 2014 | -- | $48,510 | $4,130 | $44,380 |
Source: Public Records
Map
Nearby Homes
- 2759 Hampshire Rd Unit 3
- 2707 Lancashire Rd Unit 18
- 2640 Mayfield Rd
- 1935 Coventry Rd
- 2609 Hampshire Rd
- 1676 Glenmont Rd
- 1650 Coventry Rd
- 2568 Euclid Heights Blvd
- 1798 Middlehurst Rd
- 2940 Somerton Rd
- 1890 Woodward Ave
- 2469 Overlook Rd Unit 8
- 2763 Derbyshire Rd
- 2472 Overlook Rd Unit 10
- 1635 Hillcrest Rd
- 2460 Overlook Rd Unit 2
- 1602 Hillcrest Rd
- 2843 E Derbyshire Rd
- 1546 Glenmont Rd
- 3007 Edgehill Rd
- 2725 Hampshire Rd
- 2725 Hampshire Rd Unit 6
- 2725 Hampshire Rd
- 2725 Hampshire Rd Unit 4
- 2725 Hampshire Rd Unit 1
- 2725 Hampshire Rd Unit 5
- 2725 Hampshire Rd Unit 7
- 2717 Hampshire Rd Unit 2
- 2717 Hampshire Rd
- 2713 Hampshire Rd Unit 5
- 2713 Hampshire Rd Unit 8
- 2713 Hampshire Rd Unit 2
- 2713 Hampshire Rd Unit 3
- 2713 Hampshire Rd Unit 5
- 2713 Hampshire Rd Unit 4
- 2713 Hampshire Rd Unit 1
- 2733 Hampshire Rd
- 2709 Hampshire Rd
- 2705 Hampshire Rd Unit 301
- 2705 Hampshire Rd