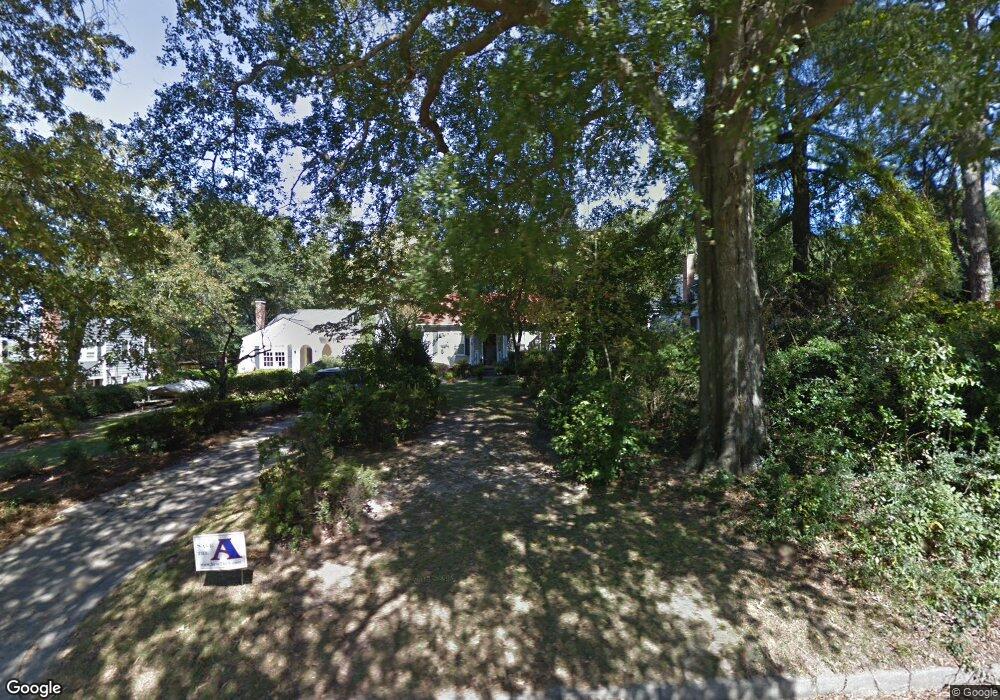
2725 Henry St Augusta, GA 30909
Forest Hills NeighborhoodEstimated Value: $269,000 - $390,000
3
Beds
2
Baths
1,600
Sq Ft
$202/Sq Ft
Est. Value
About This Home
This home is located at 2725 Henry St, Augusta, GA 30909 and is currently estimated at $323,467, approximately $202 per square foot. 2725 Henry St is a home located in Richmond County with nearby schools including Lake Forest Hills Elementary School, Tutt Middle School, and Johnson Magnet.
Ownership History
Date
Name
Owned For
Owner Type
Purchase Details
Closed on
Jun 9, 2021
Sold by
Fisk Diane
Bought by
Engler Amy
Current Estimated Value
Purchase Details
Closed on
Dec 2, 2008
Sold by
Fisk Diane L and Fisk Diane
Bought by
Fisk Diane L and Revocable Trust Under Agreemen
Purchase Details
Closed on
Jun 27, 2005
Sold by
Mancuso John P
Bought by
Fisk Diane
Purchase Details
Closed on
Nov 12, 1999
Sold by
Mcleod David G
Bought by
Mancuso John P
Home Financials for this Owner
Home Financials are based on the most recent Mortgage that was taken out on this home.
Original Mortgage
$92,000
Interest Rate
7.81%
Purchase Details
Closed on
Jan 14, 1994
Sold by
Mclendon Philip L
Bought by
Mcleod David G
Purchase Details
Closed on
Dec 31, 1991
Sold by
Flythe Maryan Doris
Bought by
Mclendon Philip L
Purchase Details
Closed on
Aug 17, 1989
Sold by
Doris Edward J By Exrxs
Bought by
Flythe Maryan Doris Doris Alice Coo
Create a Home Valuation Report for This Property
The Home Valuation Report is an in-depth analysis detailing your home's value as well as a comparison with similar homes in the area
Home Values in the Area
Average Home Value in this Area
Purchase History
We collect this data history from publicly available records. To have your information removed, we recommend requesting removal directly through your county’s website.
| Date | Buyer | Sale Price | Title Company |
|---|---|---|---|
| Engler Amy | -- | -- | |
| Fisk Diane L | -- | None Available | |
| Fisk Diane L Trustee | -- | -- | |
| Fisk Diane | $5,158,000 | -- | |
| Fisk Diane | $158,000 | -- | |
| Mancuso John P | $115,000 | -- | |
| -- | $115,000 | -- | |
| Mcleod David G | $83,900 | -- | |
| Mclendon Philip L | $76,900 | -- | |
| Flythe Maryan Doris Doris Alice Coo | -- | -- |
Source: Public Records
Mortgage History
We collect this data history from publicly available records. To have your information removed, we recommend requesting removal directly through your county’s website.
| Date | Status | Borrower | Loan Amount |
|---|---|---|---|
| Previous Owner | -- | $92,000 |
Source: Public Records
Tax History
| Year | Tax Paid | Tax Assessment Tax Assessment Total Assessment is a certain percentage of the fair market value that is determined by local assessors to be the total taxable value of land and additions on the property. | Land | Improvement |
|---|---|---|---|---|
| 2025 | $3,658 | $113,200 | $29,836 | $83,364 |
| 2024 | $3,658 | $106,392 | $29,836 | $76,556 |
| 2023 | $3,390 | $103,848 | $29,836 | $74,012 |
| 2022 | $2,823 | $82,174 | $29,836 | $52,338 |
| 2021 | $2,792 | $71,827 | $29,836 | $41,991 |
| 2020 | $2,124 | $54,910 | $19,292 | $35,618 |
| 2019 | $2,255 | $54,910 | $19,292 | $35,618 |
| 2018 | $2,272 | $54,910 | $19,292 | $35,618 |
| 2017 | $2,261 | $54,910 | $19,292 | $35,618 |
| 2016 | $2,262 | $54,910 | $19,292 | $35,618 |
| 2015 | $2,276 | $54,910 | $19,292 | $35,618 |
| 2014 | $2,279 | $54,910 | $19,292 | $35,618 |
Source: Public Records
Map
Nearby Homes
- 2716 Hazel St
- 801 Monte Sano Ave Unit A5
- 801 Monte Sano Ave Unit C4
- 801 Monte Sano Ave Unit B1
- 2818 Hazel St
- 3348 Walton Way
- 2602 Walton Way
- 701 Beacon Hill Ln
- 2559 Walton Way
- 2843 Helen St
- 2551 Mount Auburn St
- 542 Basin St
- 543 Basin St
- 2541 Wheeler Rd
- 505 1st Ave
- 2844 Lombardy Ct
- 2533 Wheeler Rd
- 531 Martin Ln
- 13 Indian Cove Rd
- 3011 Fox Spring Rd
- 2727 Henry St
- 2723 Henry St
- 2729 Henry St
- 2719 Henry St
- 2708 Oakland Ave
- 2706 Oakland Ave
- 2733 Henry St
- 2710 Oakland Ave
- 2704 Oakland Ave
- 2705 Henry St
- 2712 Oakland Ave
- 2702 Oakland Ave
- 2714 Oakland Ave
- 2720 Henry St
- 2735 Henry St
- 2716 Oakland Ave
- 2726 Henry St
- 907 Highland Ave
- 2724 Henry St
- 2701 Henry St
Your Personal Tour Guide
Ask me questions while you tour the home.