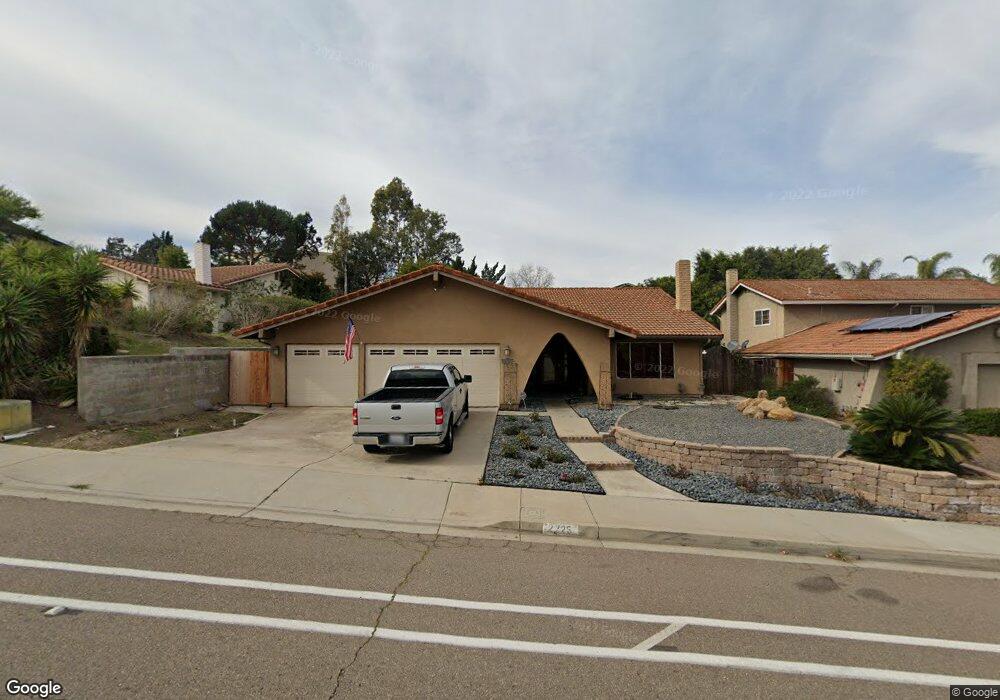
2725 Windmill View Rd El Cajon, CA 92020
Fletcher Hills NeighborhoodEstimated Value: $942,000 - $1,152,000
4
Beds
2
Baths
2,030
Sq Ft
$500/Sq Ft
Est. Value
About This Home
This home is located at 2725 Windmill View Rd, El Cajon, CA 92020 and is currently estimated at $1,015,817, approximately $500 per square foot. 2725 Windmill View Rd is a home located in San Diego County with nearby schools including Fletcher Hills Elementary School, Parkway Academy, and West Hills High School.
Ownership History
Date
Name
Owned For
Owner Type
Purchase Details
Closed on
Oct 12, 2010
Sold by
Denis Lisa and Sabb Robert
Bought by
Denis Lisa
Current Estimated Value
Home Financials for this Owner
Home Financials are based on the most recent Mortgage that was taken out on this home.
Original Mortgage
$267,500
Outstanding Balance
$2,016
Interest Rate
4.33%
Mortgage Type
New Conventional
Estimated Equity
$1,013,801
Purchase Details
Closed on
May 14, 1998
Sold by
Kendall Kirk and Kendall Amanda C
Bought by
Denis Lisa
Home Financials for this Owner
Home Financials are based on the most recent Mortgage that was taken out on this home.
Original Mortgage
$200,000
Interest Rate
7.17%
Purchase Details
Closed on
Aug 8, 1996
Sold by
Rodriguez Amy C and Rodriguez Caroline Amanda
Bought by
Beck Amanda Caroline and Witherow Kirk George
Purchase Details
Closed on
Nov 9, 1995
Sold by
Rodriguez Anthony J and Rodriguez Amy C
Bought by
Rodriguez Amy C
Purchase Details
Closed on
Jun 10, 1991
Purchase Details
Closed on
Mar 30, 1984
Create a Home Valuation Report for This Property
The Home Valuation Report is an in-depth analysis detailing your home's value as well as a comparison with similar homes in the area
Home Values in the Area
Average Home Value in this Area
Purchase History
| Date | Buyer | Sale Price | Title Company |
|---|---|---|---|
| Denis Lisa | -- | Corinthian Title Company | |
| Denis Lisa | $250,000 | Fidelity National Title | |
| Beck Amanda Caroline | -- | -- | |
| Rodriguez Amy C | -- | -- | |
| -- | $254,000 | -- | |
| -- | $148,000 | -- |
Source: Public Records
Mortgage History
| Date | Status | Borrower | Loan Amount |
|---|---|---|---|
| Open | Denis Lisa | $267,500 | |
| Closed | Denis Lisa | $200,000 |
Source: Public Records
Tax History
| Year | Tax Paid | Tax Assessment Tax Assessment Total Assessment is a certain percentage of the fair market value that is determined by local assessors to be the total taxable value of land and additions on the property. | Land | Improvement |
|---|---|---|---|---|
| 2025 | $5,134 | $399,160 | $117,639 | $281,521 |
| 2024 | $5,134 | $391,334 | $115,333 | $276,001 |
| 2023 | $4,861 | $383,662 | $113,072 | $270,590 |
| 2022 | $5,039 | $376,140 | $110,855 | $265,285 |
| 2021 | $5,103 | $368,766 | $108,682 | $260,084 |
| 2020 | $5,111 | $364,986 | $107,568 | $257,418 |
| 2019 | $4,103 | $357,830 | $105,459 | $252,371 |
| 2018 | $4,016 | $350,815 | $103,392 | $247,423 |
| 2017 | $31 | $343,937 | $101,365 | $242,572 |
| 2016 | $3,827 | $337,194 | $99,378 | $237,816 |
| 2015 | $3,799 | $332,130 | $97,886 | $234,244 |
| 2014 | $3,722 | $325,625 | $95,969 | $229,656 |
Source: Public Records
Map
Nearby Homes
- 2148 Estela Dr
- 8431 Desiree Ln
- 1951 Belmore Ct
- 9144 Fanita Rancho Rd
- 1927 Belmore Ct
- 2086 Valley Lake Dr
- 8035 Calle Fanita
- 8420 Fanita Dr Unit 3
- 8438 Fanita Dr
- 9428 Prospect Ave
- 0000 Prospect Ave
- 9219 Via de Amor
- 8515 Placid View Dr
- 8513 Placid View Dr
- 8535 Placid View Dr
- 8619 Hacienda Rd
- 0 Hacienda Dr
- 8772 Glen Vista Way
- 9459 Mission Gorge Rd Unit 121
- 1510 Eagle Ln
- 2737 Windmill View Rd
- 2713 Windmill View Rd
- 2749 Windmill View Rd
- 2701 Windmill View Rd
- 2763 Windmill View Rd
- 2736 Windmill View Rd
- 2724 Windmill View Rd
- 2697 Windmill View Rd
- 2758 Windmill View Rd
- 2712 Windmill View Rd
- 2751 Windmill View Rd
- 2775 Windmill View Rd
- 2708 Windmill View Rd
- 2772 Windmill View Rd
- 2693 Windmill View Rd
- 2784 Windmill View Rd
- 2787 Windmill View Rd
- 2689 Windmill View Rd
- 2091 Ventana Way
- 2156 Estela Dr
Your Personal Tour Guide
Ask me questions while you tour the home.