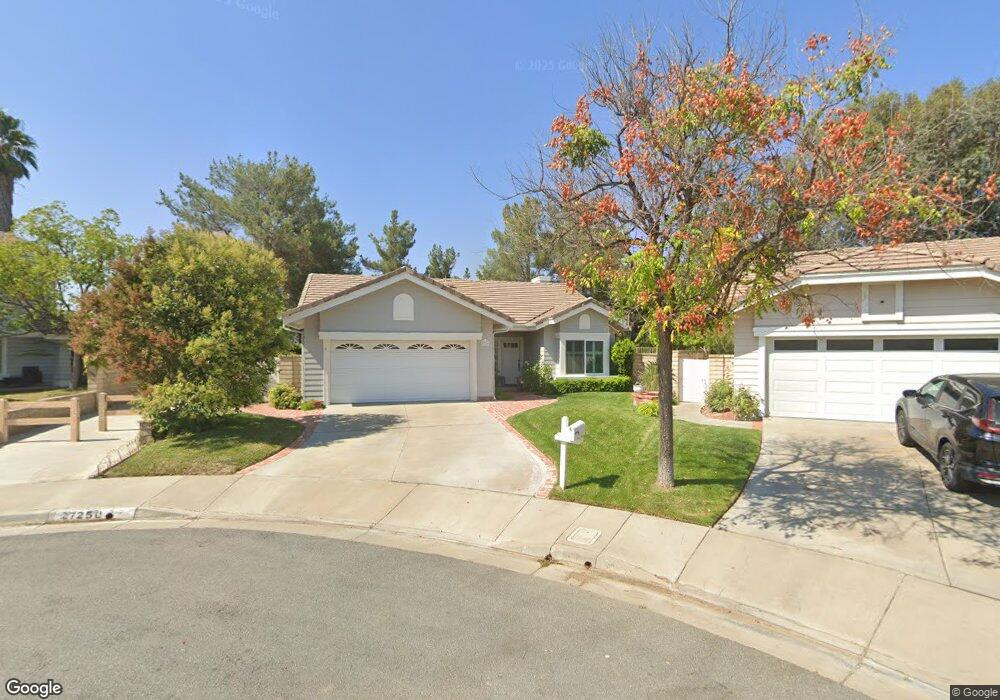
27250 Sanford Way Valencia, CA 91354
Estimated Value: $790,697 - $849,000
2
Beds
2
Baths
1,302
Sq Ft
$635/Sq Ft
Est. Value
About This Home
This home is located at 27250 Sanford Way, Valencia, CA 91354 and is currently estimated at $827,174, approximately $635 per square foot. 27250 Sanford Way is a home located in Los Angeles County with nearby schools including Charles Helmers Elementary School, Rio Norte Junior High School, and Valencia High School.
Ownership History
Date
Name
Owned For
Owner Type
Purchase Details
Closed on
Jul 18, 2019
Sold by
Matson Deborah
Bought by
Matson Deborah and Deborah Matson Living Trust
Current Estimated Value
Purchase Details
Closed on
Apr 21, 2011
Sold by
Sawyer Margaret B
Bought by
Sawyer Margaret B and Margaret B Sawyer Living Trust
Purchase Details
Closed on
Aug 24, 2001
Sold by
Doody Richard J and Doody Sheila R
Bought by
Sawyer Margaret B
Home Financials for this Owner
Home Financials are based on the most recent Mortgage that was taken out on this home.
Original Mortgage
$50,000
Interest Rate
6.9%
Purchase Details
Closed on
Mar 23, 2000
Sold by
Landers Ronald G
Bought by
Doody Richard J and Doody Shiela R
Home Financials for this Owner
Home Financials are based on the most recent Mortgage that was taken out on this home.
Original Mortgage
$187,500
Interest Rate
8.24%
Create a Home Valuation Report for This Property
The Home Valuation Report is an in-depth analysis detailing your home's value as well as a comparison with similar homes in the area
Home Values in the Area
Average Home Value in this Area
Purchase History
| Date | Buyer | Sale Price | Title Company |
|---|---|---|---|
| Matson Deborah | -- | None Available | |
| Matson Deborah | -- | None Available | |
| Sawyer Margaret B | -- | None Available | |
| Sawyer Margaret B | $275,000 | Old Republic Title Company | |
| Doody Richard J | $250,000 | Southland Title |
Source: Public Records
Mortgage History
| Date | Status | Borrower | Loan Amount |
|---|---|---|---|
| Previous Owner | Sawyer Margaret B | $50,000 | |
| Previous Owner | Doody Richard J | $187,500 | |
| Closed | Sawyer Margaret B | $135,000 |
Source: Public Records
Tax History Compared to Growth
Tax History
| Year | Tax Paid | Tax Assessment Tax Assessment Total Assessment is a certain percentage of the fair market value that is determined by local assessors to be the total taxable value of land and additions on the property. | Land | Improvement |
|---|---|---|---|---|
| 2025 | $6,570 | $406,238 | $261,326 | $144,912 |
| 2024 | $6,570 | $398,273 | $256,202 | $142,071 |
| 2023 | $6,380 | $390,465 | $251,179 | $139,286 |
| 2022 | $6,375 | $382,809 | $246,254 | $136,555 |
| 2021 | $6,183 | $375,304 | $241,426 | $133,878 |
| 2020 | $6,047 | $371,457 | $238,951 | $132,506 |
| 2019 | $5,915 | $364,174 | $234,266 | $129,908 |
| 2018 | $5,761 | $357,034 | $229,673 | $127,361 |
| 2016 | $5,364 | $343,171 | $220,755 | $122,416 |
| 2015 | $5,189 | $338,018 | $217,440 | $120,578 |
| 2014 | $5,183 | $331,398 | $213,181 | $118,217 |
Source: Public Records
Map
Nearby Homes
- 27251 Blakely Place
- 27358 Brighton Ln
- 27100 Sanford Way
- 23604 Sunderland Ct
- 23422 Westford Place
- 27448 Bridgewater Dr
- 23908 Gilford Place
- 27139 Vista Encantada Dr
- 27386 Dearborn Dr
- 27503 Wellsley Way
- 27446 Acacia Dr
- 23633 Big Sky Walk Unit 129
- 27504 Courtview Dr
- 27109 Teton Trail Unit 90
- 24040 Whitewater Dr
- 24081 Stone Creek Dr
- 27545 Wellsley Way
- 23132 Posada Dr
- 23612 Muir Trail Unit 74
- 24362 Corte Parillada
- 27248 Sanford Way
- 27251 Sanford Way
- 27249 Sanford Way
- 27244 Sanford Way
- 27238 Sanford Way
- 27245 Sanford Way
- 27261 Blakely Place
- 27257 Blakely Place
- 27267 Blakely Place
- 27239 Sanford Way
- 27234 Sanford Way
- 27245 Blakely Place
- 27271 Blakely Place
- 23603 Ashland Ct
- 27300 Brighton Ln
- 27241 Blakely Place
- 27228 Sanford Way
- 23607 Ashland Ct
- 27302 Brighton Ln
- 23613 Ashland Ct