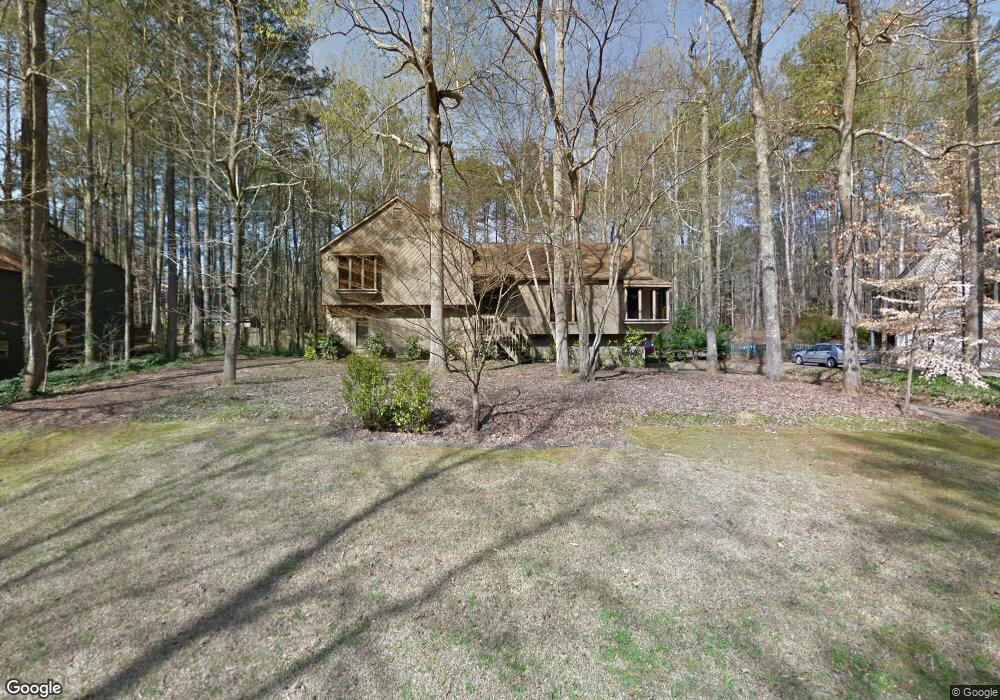
2726 Spencers Trace NE Marietta, GA 30062
East Cobb NeighborhoodEstimated Value: $428,000 - $485,000
3
Beds
3
Baths
1,585
Sq Ft
$292/Sq Ft
Est. Value
About This Home
This home is located at 2726 Spencers Trace NE, Marietta, GA 30062 and is currently estimated at $462,205, approximately $291 per square foot. 2726 Spencers Trace NE is a home located in Cobb County with nearby schools including Mountain View Elementary School, Hightower Trail Middle School, and Pope High School.
Ownership History
Date
Name
Owned For
Owner Type
Purchase Details
Closed on
Jun 21, 2007
Sold by
Sewell Mark D and Sewell Melody M
Bought by
Maltby Ryan A and Maltby Melissa J
Current Estimated Value
Home Financials for this Owner
Home Financials are based on the most recent Mortgage that was taken out on this home.
Original Mortgage
$162,400
Outstanding Balance
$98,405
Interest Rate
6.1%
Mortgage Type
New Conventional
Estimated Equity
$363,800
Purchase Details
Closed on
Nov 13, 1997
Sold by
Jackson Stephen E
Bought by
Sewell Mark D
Home Financials for this Owner
Home Financials are based on the most recent Mortgage that was taken out on this home.
Original Mortgage
$135,960
Interest Rate
7.5%
Mortgage Type
VA
Purchase Details
Closed on
May 27, 1993
Sold by
Swift Nita F
Bought by
Jackson Stephen E
Home Financials for this Owner
Home Financials are based on the most recent Mortgage that was taken out on this home.
Original Mortgage
$127,100
Interest Rate
7.39%
Mortgage Type
FHA
Create a Home Valuation Report for This Property
The Home Valuation Report is an in-depth analysis detailing your home's value as well as a comparison with similar homes in the area
Home Values in the Area
Average Home Value in this Area
Purchase History
| Date | Buyer | Sale Price | Title Company |
|---|---|---|---|
| Maltby Ryan A | $203,000 | -- | |
| Sewell Mark D | $132,000 | -- | |
| Jackson Stephen E | $129,000 | -- |
Source: Public Records
Mortgage History
| Date | Status | Borrower | Loan Amount |
|---|---|---|---|
| Open | Maltby Ryan A | $162,400 | |
| Previous Owner | Sewell Mark D | $135,960 | |
| Previous Owner | Jackson Stephen E | $127,100 |
Source: Public Records
Tax History Compared to Growth
Tax History
| Year | Tax Paid | Tax Assessment Tax Assessment Total Assessment is a certain percentage of the fair market value that is determined by local assessors to be the total taxable value of land and additions on the property. | Land | Improvement |
|---|---|---|---|---|
| 2025 | $3,724 | $157,040 | $52,000 | $105,040 |
| 2024 | $3,773 | $159,128 | $40,000 | $119,128 |
| 2023 | $3,088 | $152,584 | $28,000 | $124,584 |
| 2022 | $3,659 | $152,584 | $28,000 | $124,584 |
| 2021 | $2,926 | $119,060 | $28,000 | $91,060 |
| 2020 | $2,668 | $107,304 | $28,000 | $79,304 |
| 2019 | $2,668 | $107,304 | $28,000 | $79,304 |
| 2018 | $2,034 | $78,332 | $23,600 | $54,732 |
| 2017 | $1,940 | $78,332 | $23,600 | $54,732 |
| 2016 | $1,796 | $71,756 | $22,000 | $49,756 |
| 2015 | $1,570 | $62,128 | $19,000 | $43,128 |
| 2014 | $1,583 | $62,128 | $0 | $0 |
Source: Public Records
Map
Nearby Homes
- 3091 Branford Ct
- 2864 Saint Andrews Way NE
- 2260 Falkirk Pointe Dr
- 2735 Wendy Ln
- 3237 Harvest Way
- 2607 Lulworth Ln
- 2934 Wendover St
- 2853 Wendwood Dr
- 3287 Harvest Way
- 2998 Kodiak Ct
- 2760 Hembree Rd NE
- 2963 Timberline Rd Unit 2
- 3071 Intrepid Wake
- 3297 Post Oak Tritt Rd
- 2919 Manitoba Ln
- 2726 Riderwood Ln NE
- 2720 Spencers Trace NE
- 2732 Spencers Trace NE
- 2738 Spencers Trace NE
- 2714 Spencers Trace NE
- 2714 Lange Ct NE
- 2744 Spencers Trace NE
- 2725 Spencers Trace NE
- 2718 Lange Ct NE
- 2731 Spencers Trace NE
- 2717 Spencers Trace NE
- 2710 Lange Ct NE
- 0 Lange Ct NE Unit 7244185
- 2708 Spencers Trace NE
- 2735 Spencers Trace NE
- 2722 Lange Ct NE
- 2711 Spencers Trace NE
- 2702 Spencers Trace NE
- 2743 Spencers Trace NE
- 2745 Spencers Trace NE
- 2707 Spencers Trace NE