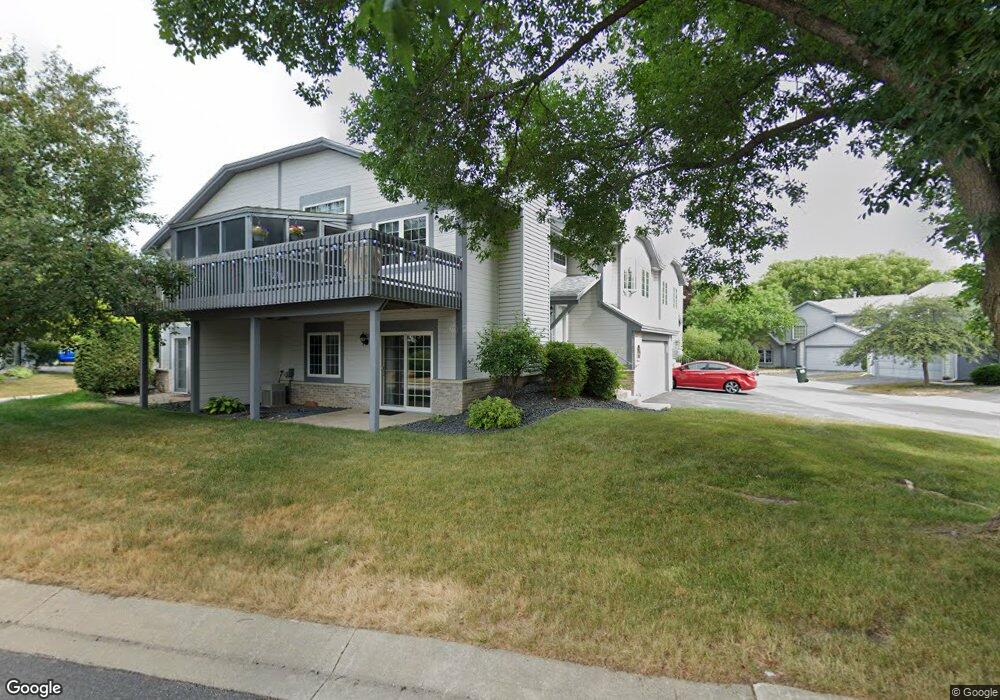
2726 Spyglass Ct NW Rochester, MN 55901
Elton Hills NeighborhoodEstimated Value: $259,000 - $285,000
2
Beds
2
Baths
1,071
Sq Ft
$252/Sq Ft
Est. Value
About This Home
This home is located at 2726 Spyglass Ct NW, Rochester, MN 55901 and is currently estimated at $270,044, approximately $252 per square foot. 2726 Spyglass Ct NW is a home located in Olmsted County with nearby schools including Churchill Elementary School, Hoover Elementary School, and Kellogg Middle School.
Ownership History
Date
Name
Owned For
Owner Type
Purchase Details
Closed on
May 5, 2022
Sold by
Mccort Bridget
Bought by
Detry Anna and Detry Michelle
Current Estimated Value
Home Financials for this Owner
Home Financials are based on the most recent Mortgage that was taken out on this home.
Original Mortgage
$196,000
Outstanding Balance
$184,736
Interest Rate
4.42%
Mortgage Type
New Conventional
Estimated Equity
$85,308
Purchase Details
Closed on
Jul 26, 2019
Sold by
Stanslaski Brian and Stanslaski Eric
Bought by
Mccort Bridget L
Home Financials for this Owner
Home Financials are based on the most recent Mortgage that was taken out on this home.
Original Mortgage
$201,435
Interest Rate
3.7%
Mortgage Type
VA
Purchase Details
Closed on
Jan 12, 2012
Sold by
Orwoll Kathleen J B and Orwall Kimball
Bought by
Stanslaski Merridy L
Home Financials for this Owner
Home Financials are based on the most recent Mortgage that was taken out on this home.
Original Mortgage
$94,687
Interest Rate
4.12%
Mortgage Type
FHA
Create a Home Valuation Report for This Property
The Home Valuation Report is an in-depth analysis detailing your home's value as well as a comparison with similar homes in the area
Home Values in the Area
Average Home Value in this Area
Purchase History
| Date | Buyer | Sale Price | Title Company |
|---|---|---|---|
| Detry Anna | $245,000 | -- | |
| Mccort Bridget L | $195,000 | None Available | |
| Stanslaski Merridy L | $125,000 | None Available |
Source: Public Records
Mortgage History
| Date | Status | Borrower | Loan Amount |
|---|---|---|---|
| Open | Detry Anna | $196,000 | |
| Previous Owner | Mccort Bridget L | $201,435 | |
| Previous Owner | Stanslaski Merridy L | $94,687 |
Source: Public Records
Tax History Compared to Growth
Tax History
| Year | Tax Paid | Tax Assessment Tax Assessment Total Assessment is a certain percentage of the fair market value that is determined by local assessors to be the total taxable value of land and additions on the property. | Land | Improvement |
|---|---|---|---|---|
| 2024 | $3,320 | $256,500 | $30,000 | $226,500 |
| 2023 | $2,854 | $240,000 | $20,000 | $220,000 |
| 2022 | $2,508 | $213,800 | $20,000 | $193,800 |
| 2021 | $2,350 | $198,900 | $20,000 | $178,900 |
| 2020 | $2,244 | $187,900 | $20,000 | $167,900 |
| 2019 | $2,006 | $174,700 | $20,000 | $154,700 |
| 2018 | $1,875 | $159,700 | $11,200 | $148,500 |
| 2017 | $1,786 | $156,100 | $11,200 | $144,900 |
| 2016 | $1,546 | $118,500 | $9,300 | $109,200 |
| 2015 | $1,460 | $99,900 | $8,900 | $91,000 |
| 2014 | $1,432 | $101,400 | $8,900 | $92,500 |
| 2012 | -- | $127,900 | $11,200 | $116,700 |
Source: Public Records
Map
Nearby Homes
- 2717 Spyglass Ct NW
- 3037 Venice Ln NW
- 526 Zumbro Dr NW
- 414 31st St NW
- 2645 Riverside Ln NE
- 411 31st St NW
- 3002 7th Ave NW
- 3406 Leisure Ct NW
- 3348 Geselle Ln NW
- 366 Elton Hills Dr NW Unit 34
- 366 Elton Hills Dr NW Unit 12
- 362 Elton Hills Dr NW Unit 18
- 19 Elton Ridge Ct NW
- 2011 Viking Dr NW Unit 23
- 2011 Viking Dr NW Unit 33
- 2011 Viking Dr NW Unit 27
- 215 Elton Hills Dr NW Unit 37
- 215 Elton Hills Dr NW Unit 52
- 280 Penny Ln NE
- 905 Chalet Dr NW
- 2727 Spyglass Ct NW
- 2725 Spyglass Ct NW
- 2724 Spyglass Ct NW
- 2742 Spyglass Ct NW
- 2707 Spyglass Ct NW
- 2729 Spyglass Ct NW
- 2708 Spyglass Ct NW
- 2706 Spyglass Ct NW
- 2734 Spyglass Ct NW
- 2709 Spyglass Ct NW
- 2741 Spyglass Ct NW
- 2730 Spyglass Ct NW
- 2704 Spyglass Ct NW
- 2721 Spyglass Ct NW
- 2735 Spyglass Ct NW
- 2711 Spyglass Ct NW
- 2720 Spyglass Ct NW
- 2703 Spyglass Ct NW
- 2740 Spyglass Ct NW
- 2739 Spyglass Ct NW