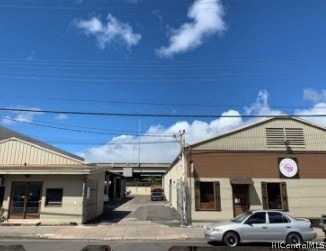


2726 Waiwai Loop Honolulu, HI 96819
Estimated payment $77,870/month
About This Lot
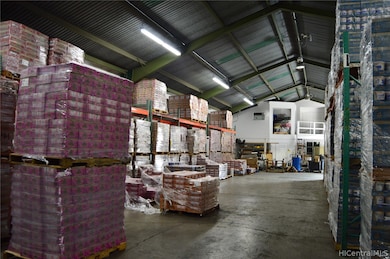
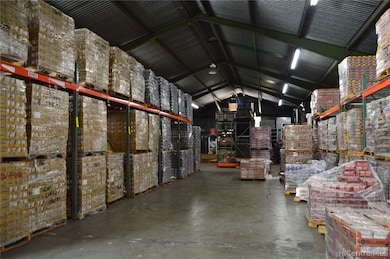
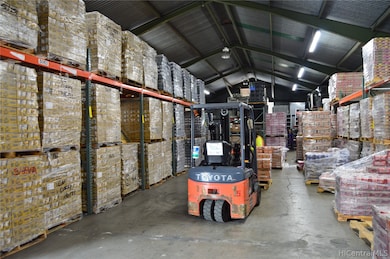
Located near Honolulu Internation Airport and the future rail station, this approximately 20,140 square foot lot has
many possibilities. Warehouse, storage building, commercial space, and more!
Listing Agent
Coldwell Banker Realty Brokerage Phone: (808) 676-7200 License #RS-70424 Listed on: 11/18/2019

Property Details
Property Type
- Land
Est. Annual Taxes
- $50,790
Lot Details
- 0.46 Acre Lot
- Level Lot
- Zoning described as 42 - I-2 General Industrial Dis
Community Details
- Airport/Industl Subdivision
Listing and Financial Details
- Assessor Parcel Number 1-1-1-016-038-0000
Map
Home Values in the Area
Average Home Value in this Area
Tax History
| Year | Tax Paid | Tax Assessment Tax Assessment Total Assessment is a certain percentage of the fair market value that is determined by local assessors to be the total taxable value of land and additions on the property. | Land | Improvement |
|---|---|---|---|---|
| 2025 | $53,353 | $4,305,200 | $4,021,000 | $284,200 |
| 2024 | $53,353 | $4,302,700 | $4,021,000 | $281,700 |
| 2023 | $50,790 | $4,096,000 | $3,820,000 | $276,000 |
| 2022 | $49,348 | $3,979,700 | $3,719,400 | $260,300 |
| 2021 | $47,060 | $3,795,200 | $3,518,400 | $276,800 |
| 2020 | $47,323 | $3,816,400 | $3,518,400 | $298,000 |
| 2019 | $47,373 | $3,820,400 | $3,518,400 | $302,000 |
| 2018 | $40,965 | $3,303,600 | $3,010,500 | $293,100 |
| 2017 | $37,630 | $3,034,700 | $2,709,500 | $325,200 |
| 2016 | $35,174 | $2,836,600 | $2,508,800 | $327,800 |
| 2015 | $33,763 | $2,722,800 | $2,408,400 | $314,400 |
| 2014 | $27,444 | $2,519,100 | $2,207,700 | $311,400 |
Property History
| Date | Event | Price | List to Sale | Price per Sq Ft |
|---|---|---|---|---|
| 11/18/2019 11/18/19 | For Sale | $13,999,000 | -- | -- |
Purchase History
| Date | Type | Sale Price | Title Company |
|---|---|---|---|
| Warranty Deed | $1,875,000 | -- |
Mortgage History
| Date | Status | Loan Amount | Loan Type |
|---|---|---|---|
| Open | $1,350,000 | Commercial |
Source: HiCentral MLS (Honolulu Board of REALTORS®)
MLS Number: 201927213
APN: 1-1-1-016-038-0000
Disclaimer: Certain information contained herein is derived from information provided by parties other than Homes.com. All information provided is deemed reliable, but is not guaranteed to be accurate and should be independently verified.
![]() Some of the active listings appearing on this site may be listed by other REALTORS(R). If you are interested in those active listings, our company may represent you as the buyer's agent. If the active listing you are interested in is our company's active listing, you may speak to one of our agents regarding your options for representation.
Some of the active listings appearing on this site may be listed by other REALTORS(R). If you are interested in those active listings, our company may represent you as the buyer's agent. If the active listing you are interested in is our company's active listing, you may speak to one of our agents regarding your options for representation.
Based on information from the Multiple Listing Service of HiCentral MLS, Ltd. Information is deemed reliable but not guaranteed. Copyright 2025 HiCentral MLS, Ltd
- 1015 Ala Napunani St Unit 802
- 1015 Ala Napunani St Unit 804
- 2929 Ala Ilima St Unit 303
- 2929 Ala Ilima St Unit 202
- 2888 Ala Ilima St Unit 1512
- 2888 Ala Ilima St Unit 910
- 2888 Ala Ilima St Unit 2309
- 2888 Ala Ilima St Unit 1901
- 2888 Ala Ilima St Unit 611
- 5400 Likini St Unit 203
- 2977 Ala Ilima St Unit 709
- 2977 Ala Ilima St Unit 809
- 2977 Ala Ilima St Unit 705
- 2977 Ala Ilima St Unit 610
- 3020 Ala Napuaa Place Unit 404
- 3045 Ala Napuaa Place Unit 1814
- 3045 Ala Napuaa Place Unit 1613
- 3045 Ala Napuaa Place Unit 319
- 3045 Ala Napuaa Place Unit 306
- 3045 Ala Napuaa Place Unit 1518
- 2889 Ala Ilima St Unit 11B
- 2888 Ala Ilima St Unit 1305
- 2888 Ala Ilima St Unit 1401
- 3121 Ala Ilima St Unit 112
- 1090 Ala Napunani St Unit 420
- 3161 Ala Ilima St Unit 1403
- 3161 Ala Ilima St
- 1160 Ala Napunani St Unit 702
- 949 Ala Nanala St Unit 501
- 949 Ala Nanala St Unit 1004
- 3215 Ala Ilima St Unit A1202
- 3215 Ala Ilima St Unit B502
- 990 Ala Nanala St Unit 20D
- 5122 Likini St Unit 716
- 1924 Kalani St Unit 4
- 975 Ala Lilikoi St Unit 503
- 975 Ala Lilikoi St Unit 503 #1
- 2326 Rose St
- 3403 Ala Ilima St
- 2470 Lakoloa Place