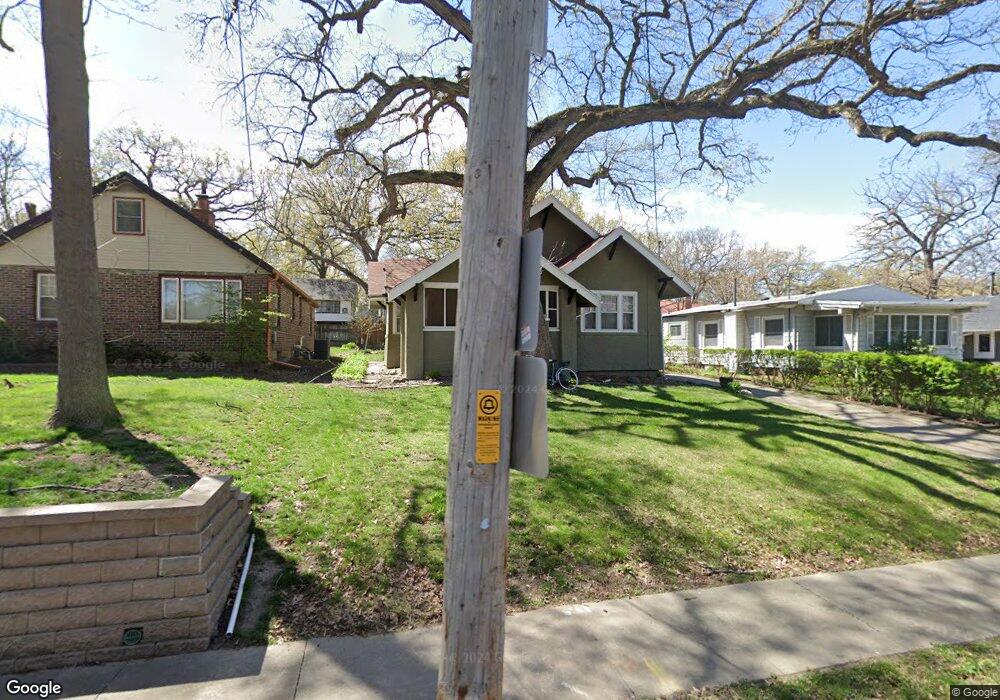
2726 Witmer St Des Moines, IA 50310
Drake NeighborhoodEstimated Value: $161,000 - $178,397
2
Beds
1
Bath
1,136
Sq Ft
$149/Sq Ft
Est. Value
About This Home
This home is located at 2726 Witmer St, Des Moines, IA 50310 and is currently estimated at $168,849, approximately $148 per square foot. 2726 Witmer St is a home located in Polk County with nearby schools including Monroe Elementary School, Meredith Middle School, and Hoover High School.
Ownership History
Date
Name
Owned For
Owner Type
Purchase Details
Closed on
Jun 29, 2005
Sold by
Rottler Steven P
Bought by
Gonzalez Angelina
Current Estimated Value
Home Financials for this Owner
Home Financials are based on the most recent Mortgage that was taken out on this home.
Original Mortgage
$75,110
Outstanding Balance
$39,187
Interest Rate
5.75%
Mortgage Type
FHA
Estimated Equity
$129,662
Purchase Details
Closed on
Feb 15, 2000
Sold by
Estate Of Joan Dee Rottler and Rottler Steven P
Bought by
Rottler Steven P and The Joan Dee Rottler Family Trust
Purchase Details
Closed on
Nov 4, 1998
Sold by
Rottler Steven P and Rottler Joan Dee
Bought by
Rottler Joan Dee
Create a Home Valuation Report for This Property
The Home Valuation Report is an in-depth analysis detailing your home's value as well as a comparison with similar homes in the area
Home Values in the Area
Average Home Value in this Area
Purchase History
| Date | Buyer | Sale Price | Title Company |
|---|---|---|---|
| Gonzalez Angelina | $82,000 | -- | |
| Rottler Steven P | -- | -- | |
| Rottler Joan Dee | -- | -- |
Source: Public Records
Mortgage History
| Date | Status | Borrower | Loan Amount |
|---|---|---|---|
| Open | Gonzalez Angelina | $75,110 |
Source: Public Records
Tax History Compared to Growth
Tax History
| Year | Tax Paid | Tax Assessment Tax Assessment Total Assessment is a certain percentage of the fair market value that is determined by local assessors to be the total taxable value of land and additions on the property. | Land | Improvement |
|---|---|---|---|---|
| 2025 | $2,836 | $164,100 | $29,300 | $134,800 |
| 2024 | $2,836 | $144,200 | $25,600 | $118,600 |
| 2023 | $2,798 | $144,200 | $25,600 | $118,600 |
| 2022 | $2,776 | $118,700 | $21,700 | $97,000 |
| 2021 | $2,610 | $118,700 | $21,700 | $97,000 |
| 2020 | $2,712 | $104,600 | $19,200 | $85,400 |
| 2019 | $3,370 | $104,600 | $19,200 | $85,400 |
| 2018 | $2,452 | $92,200 | $16,800 | $75,400 |
| 2017 | $2,502 | $92,200 | $16,800 | $75,400 |
| 2016 | $2,438 | $92,500 | $16,700 | $75,800 |
| 2015 | $2,438 | $92,500 | $16,700 | $75,800 |
| 2014 | $2,160 | $81,300 | $14,600 | $66,700 |
Source: Public Records
Map
Nearby Homes