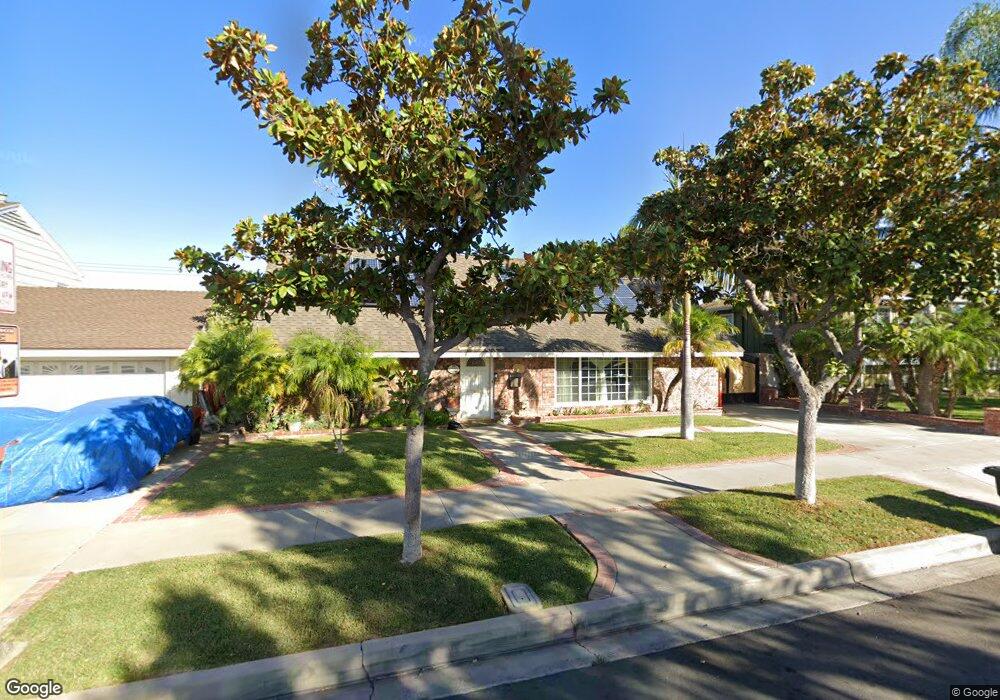
2727 E Wilson Ave Orange, CA 92867
Estimated Value: $1,144,000 - $1,450,000
5
Beds
3
Baths
2,468
Sq Ft
$526/Sq Ft
Est. Value
About This Home
This home is located at 2727 E Wilson Ave, Orange, CA 92867 and is currently estimated at $1,298,998, approximately $526 per square foot. 2727 E Wilson Ave is a home located in Orange County with nearby schools including Villa Park Elementary School, Cerro Villa Middle School, and Villa Park High School.
Ownership History
Date
Name
Owned For
Owner Type
Purchase Details
Closed on
Dec 13, 2011
Sold by
Muratalla Francisco and Muratalla Maria
Bought by
Muratalla Francisco S and Muratalla Maria M
Current Estimated Value
Purchase Details
Closed on
Aug 11, 2009
Sold by
Muratalla Francisco
Bought by
Muratalla Francisco and Muratalla Maria
Home Financials for this Owner
Home Financials are based on the most recent Mortgage that was taken out on this home.
Original Mortgage
$175,800
Interest Rate
5.3%
Mortgage Type
New Conventional
Purchase Details
Closed on
Aug 7, 2009
Sold by
Muratalla Francisco and Muratalla Maria
Bought by
Muratalla Francisco
Home Financials for this Owner
Home Financials are based on the most recent Mortgage that was taken out on this home.
Original Mortgage
$175,800
Interest Rate
5.3%
Mortgage Type
New Conventional
Create a Home Valuation Report for This Property
The Home Valuation Report is an in-depth analysis detailing your home's value as well as a comparison with similar homes in the area
Home Values in the Area
Average Home Value in this Area
Purchase History
| Date | Buyer | Sale Price | Title Company |
|---|---|---|---|
| Muratalla Francisco S | -- | None Available | |
| Muratalla Francisco | -- | None Available | |
| Muratalla Francisco | -- | First American Title Company | |
| Muratalla Francisco | -- | First American Title Company |
Source: Public Records
Mortgage History
| Date | Status | Borrower | Loan Amount |
|---|---|---|---|
| Closed | Muratalla Francisco | $175,800 |
Source: Public Records
Tax History
| Year | Tax Paid | Tax Assessment Tax Assessment Total Assessment is a certain percentage of the fair market value that is determined by local assessors to be the total taxable value of land and additions on the property. | Land | Improvement |
|---|---|---|---|---|
| 2025 | $3,189 | $339,924 | $96,194 | $243,730 |
| 2024 | $3,189 | $257,499 | $94,308 | $163,191 |
| 2023 | $2,969 | $252,450 | $92,458 | $159,992 |
| 2022 | $2,908 | $247,500 | $90,645 | $156,855 |
| 2021 | $2,829 | $242,648 | $88,868 | $153,780 |
| 2020 | $2,802 | $240,160 | $87,956 | $152,204 |
| 2019 | $2,768 | $235,451 | $86,231 | $149,220 |
| 2018 | $2,725 | $230,835 | $84,540 | $146,295 |
| 2017 | $2,617 | $226,309 | $82,882 | $143,427 |
| 2016 | $2,566 | $221,872 | $81,257 | $140,615 |
| 2015 | $2,528 | $218,540 | $80,037 | $138,503 |
| 2014 | $2,473 | $214,260 | $78,470 | $135,790 |
Source: Public Records
Map
Nearby Homes
- 1166 N Handy St
- 1440 N Harding St
- 2543 E Locust Ave
- 1420 N Sacramento St
- 773 N Elmwood St
- 2201 E Oakmont Ave
- 1801 E Collins Ave Unit 36
- 1801 E Collins Ave Unit 42
- 677 N Clinton St
- 3410 E Lambeth Ct Unit F
- 2929 E Hamilton Ave
- 692 N Adele St Unit 50
- 692 N Adele St Unit 30
- 692 N Adele St
- 692 N Adele St Unit 78
- 756 N Siavohn Dr
- 3509 E Berkshire Ct Unit C
- 3510 E Berkshire Ct Unit F
- 1540 E Trenton Ave Unit 79
- 1540 E Trenton Ave Unit 126
- 2719 E Wilson Ave
- 2735 E Wilson Ave
- 2720 E Hoover Ave
- 2712 E Hoover Ave
- 2711 E Wilson Ave
- 2704 E Hoover Ave
- 2724 E Wilson Ave
- 2732 E Wilson Ave
- 2716 E Wilson Ave
- 2647 E Wilson Ave
- 2646 E Hoover Ave
- 2740 E Wilson Ave
- 2744 E Hoover Ave
- 1179 N Hart St
- 2708 E Wilson Ave
- 1171 N Hart St
- 2639 E Wilson Ave
- 2638 E Hoover Ave
- 2731 E Adams Ave
- 2721 E Adams Ave
Your Personal Tour Guide
Ask me questions while you tour the home.