Estimated Value: $341,000 - $386,000
3
Beds
3
Baths
1,655
Sq Ft
$217/Sq Ft
Est. Value
About This Home
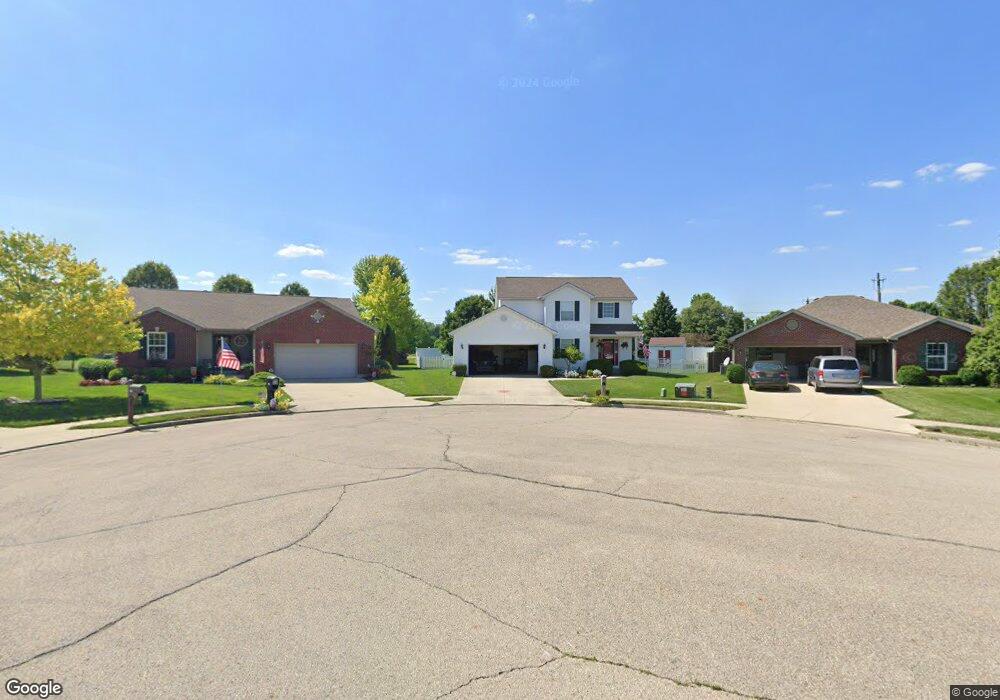
This home is located at 2727 Fieldbrook Ct, Troy, OH 45373 and is currently estimated at $358,867, approximately $216 per square foot. 2727 Fieldbrook Ct is a home located in Miami County with nearby schools including Concord Elementary School, Van Cleve Elementary School, and Troy Junior High School.
Ownership History
Date
Name
Owned For
Owner Type
Purchase Details
Closed on
Mar 1, 2016
Sold by
Robinson Jeffery S and Robinson Margaret
Bought by
Crabtree Aaron W and Crabtree Antoinette M
Current Estimated Value
Home Financials for this Owner
Home Financials are based on the most recent Mortgage that was taken out on this home.
Original Mortgage
$166,250
Outstanding Balance
$131,891
Interest Rate
3.72%
Mortgage Type
New Conventional
Estimated Equity
$226,976
Purchase Details
Closed on
May 23, 2006
Sold by
Reilly Joseph F
Bought by
Robinson Jeffrey Scott
Purchase Details
Closed on
Sep 28, 2005
Sold by
Keystone Homes Of Troy Ltd
Bought by
Reilly Joseph F
Home Financials for this Owner
Home Financials are based on the most recent Mortgage that was taken out on this home.
Original Mortgage
$131,920
Interest Rate
5.93%
Mortgage Type
New Conventional
Purchase Details
Closed on
Oct 5, 2004
Sold by
Kensington Land Co
Bought by
Keystone Homes Of Troy Ltd
Create a Home Valuation Report for This Property
The Home Valuation Report is an in-depth analysis detailing your home's value as well as a comparison with similar homes in the area
Home Values in the Area
Average Home Value in this Area
Purchase History
| Date | Buyer | Sale Price | Title Company |
|---|---|---|---|
| Crabtree Aaron W | $175,000 | First Title | |
| Robinson Jeffrey Scott | $168,700 | -- | |
| Reilly Joseph F | $164,900 | -- | |
| Keystone Homes Of Troy Ltd | $29,900 | -- |
Source: Public Records
Mortgage History
| Date | Status | Borrower | Loan Amount |
|---|---|---|---|
| Open | Crabtree Aaron W | $166,250 | |
| Previous Owner | Keystone Homes Of Troy Ltd | $131,920 |
Source: Public Records
Tax History Compared to Growth
Tax History
| Year | Tax Paid | Tax Assessment Tax Assessment Total Assessment is a certain percentage of the fair market value that is determined by local assessors to be the total taxable value of land and additions on the property. | Land | Improvement |
|---|---|---|---|---|
| 2024 | $3,295 | $87,370 | $15,930 | $71,440 |
| 2023 | $3,295 | $87,370 | $15,930 | $71,440 |
| 2022 | $2,745 | $87,370 | $15,930 | $71,440 |
| 2021 | $2,223 | $67,200 | $12,250 | $54,950 |
| 2020 | $2,226 | $67,200 | $12,250 | $54,950 |
| 2019 | $2,246 | $67,200 | $12,250 | $54,950 |
| 2018 | $2,044 | $58,840 | $12,110 | $46,730 |
| 2017 | $2,064 | $58,840 | $12,110 | $46,730 |
| 2016 | $2,033 | $58,840 | $12,110 | $46,730 |
| 2015 | $1,964 | $54,460 | $11,200 | $43,260 |
| 2014 | $1,964 | $54,460 | $11,200 | $43,260 |
| 2013 | $1,977 | $54,460 | $11,200 | $43,260 |
Source: Public Records
Map
Nearby Homes
- 1350 Winchester Dr
- 1118 Winchester Dr
- 1965 Nashville Rd
- 2537 Huntington Dr
- Holcombe Plan at Reserve at Cliff Oaks
- Chatham Plan at Reserve at Cliff Oaks
- Bridgeport Plan at Reserve at Cliff Oaks
- Newcastle Plan at Reserve at Cliff Oaks
- 2244 Blackoak Dr
- 2936 Hoying Dr
- 2944 Hoying Dr
- 2952 Hoying Dr
- 2960 Hoying Dr
- 2968 Hoying Dr
- 1985 Fox Run
- 2206 Northbridge Trail
- 1965 Quail Nest Ct
- 1811 Greenbriar Dr
- 00 W
- 2295 Shenandoah Dr
- 2713 Fieldbrook Ct
- 2701 Fieldbrook Ct
- 2741 Fieldbrook Ct
- 2721 Southside Dr
- 2717 Southside Dr
- 2734 Fieldbrook Ct
- 2726 Fieldbrook Ct
- 2712 Fieldbrook Ct
- 2685 Fieldbrook Ct
- 2700 Fieldbrook Ct
- 2720 Southside Dr
- 2735 Southside Dr
- 1180 Edgewater Dr
- 2686 Fieldbrook Ct
- 1199 Pond View Dr
- 1189 Pond View Dr
- 2675 Renwick Way
- 2672 Renwick Way
- 2749 Southside Dr
- 2732 Southside Dr