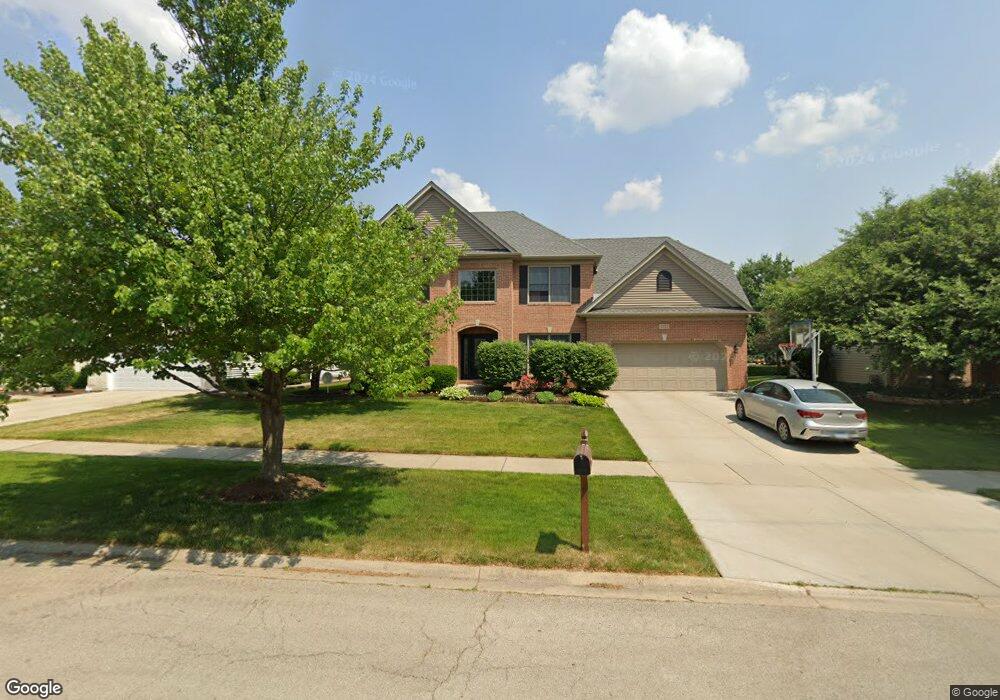
2727 Wait Rd Naperville, IL 60564
Harmony Grove NeighborhoodEstimated Value: $651,000 - $748,000
Studio
1
Bath
2,862
Sq Ft
$246/Sq Ft
Est. Value
About This Home
This home is located at 2727 Wait Rd, Naperville, IL 60564 and is currently estimated at $702,653, approximately $245 per square foot. 2727 Wait Rd is a home located in Will County with nearby schools including Oliver Julian Kendall Elementary School, Clifford Crone Middle School, and Neuqua Valley High School.
Ownership History
Date
Name
Owned For
Owner Type
Purchase Details
Closed on
Oct 1, 1998
Sold by
Continental Community Bk & Tr Company
Bought by
Hall Benjamin A and Hall Judith M
Current Estimated Value
Home Financials for this Owner
Home Financials are based on the most recent Mortgage that was taken out on this home.
Original Mortgage
$255,000
Outstanding Balance
$56,168
Interest Rate
6.97%
Estimated Equity
$646,485
Purchase Details
Closed on
May 1, 1998
Sold by
Clearwater Custom Homes
Bought by
Continental Community Bk & Tr Company and Trust #9681
Purchase Details
Closed on
Jan 14, 1998
Sold by
Shukis Builders Inc
Bought by
Clearwater Custom Homes Inc
Purchase Details
Closed on
May 28, 1997
Sold by
Maf Developments Inc
Bought by
Shukis Builders Inc
Home Financials for this Owner
Home Financials are based on the most recent Mortgage that was taken out on this home.
Original Mortgage
$53,150
Interest Rate
7.7%
Mortgage Type
Construction
Create a Home Valuation Report for This Property
The Home Valuation Report is an in-depth analysis detailing your home's value as well as a comparison with similar homes in the area
Home Values in the Area
Average Home Value in this Area
Purchase History
We collect this data history from publicly available records. To have your information removed, we recommend requesting removal directly through your county’s website.
| Date | Buyer | Sale Price | Title Company |
|---|---|---|---|
| Hall Benjamin A | $269,000 | -- | |
| Continental Community Bk & Tr Company | -- | -- | |
| Clearwater Custom Homes Inc | $71,000 | Chicago Title Insurance Co | |
| Shukis Builders Inc | $71,000 | Chicago Title Insurance Co |
Source: Public Records
Mortgage History
We collect this data history from publicly available records. To have your information removed, we recommend requesting removal directly through your county’s website.
| Date | Status | Borrower | Loan Amount |
|---|---|---|---|
| Open | Hall Benjamin A | $255,000 | |
| Previous Owner | Shukis Builders Inc | $53,150 |
Source: Public Records
Tax History
| Year | Tax Paid | Tax Assessment Tax Assessment Total Assessment is a certain percentage of the fair market value that is determined by local assessors to be the total taxable value of land and additions on the property. | Land | Improvement |
|---|---|---|---|---|
| 2024 | $13,160 | $199,250 | $43,748 | $155,502 |
| 2023 | $12,527 | $176,016 | $38,647 | $137,369 |
| 2022 | $11,264 | $161,475 | $36,560 | $124,915 |
| 2021 | $10,765 | $153,786 | $34,819 | $118,967 |
| 2020 | $10,560 | $151,349 | $34,267 | $117,082 |
| 2019 | $10,378 | $147,083 | $33,301 | $113,782 |
| 2018 | $9,765 | $136,357 | $32,568 | $103,789 |
| 2017 | $10,988 | $150,960 | $31,727 | $119,233 |
| 2016 | $10,968 | $147,710 | $31,044 | $116,666 |
| 2015 | $10,875 | $142,029 | $29,850 | $112,179 |
| 2014 | $10,875 | $138,200 | $29,850 | $108,350 |
| 2013 | $10,875 | $138,200 | $29,850 | $108,350 |
Source: Public Records
Map
Nearby Homes
- 2820 Fairhauser Ct
- 4852 Snapjack Cir
- 2508 High Meadow Rd
- 5204 Chokeberry Dr
- 4807 Clearwater Ln
- 4515 Barr Creek Ln Unit 4
- 2631 Wild Timothy Rd
- 12021 S Stallion Dr
- 11400 S Churchill Dr
- 11330 Highland Dr S
- 2607 Bangert Ct
- 4147 Royal Mews Cir Unit 204
- 2228 Snapdragon Rd
- 2412 Wild Timothy Rd
- 6027 Rosinweed Ln
- 4108 Schillinger Dr
- 2816 Cordgrass Rd Unit 1
- 3712 Ryder Ct
- 2255 Wendt Cir
- 5624 Bergamot Ct
- 2723 Wait Rd
- 2731 Wait Rd
- 4611 Mather Ct
- 2735 Wait Rd
- 4615 Mather Ct
- 2719 Wait Rd
- 4607 Mather Ct Unit 3
- 2728 Wait Rd
- 2732 Wait Rd Unit 3
- 4619 Mather Ct Unit 3
- 2724 Wait Rd
- 2736 Wait Rd
- 2715 Wait Rd
- 4616 Niswender Ct
- 4612 Niswender Ct
- 2720 Wait Rd
- 4620 Niswender Ct
- 4603 Mather Ct
- 4623 Mather Ct
- 2740 Wait Rd Unit 3
Your Personal Tour Guide
Ask me questions while you tour the home.