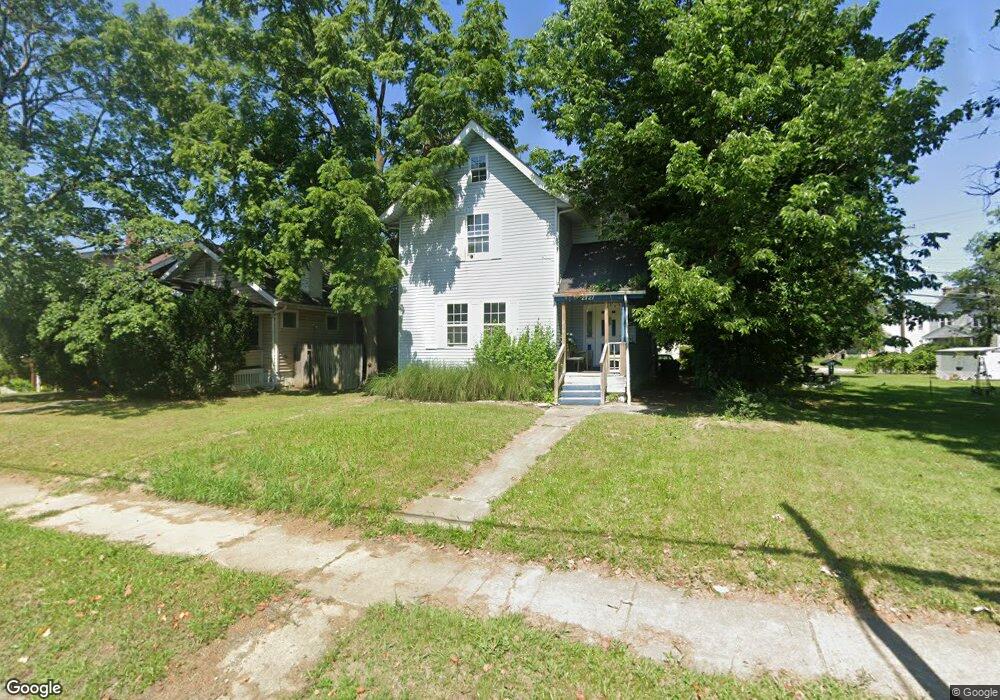
2727 Westerville Rd Columbus, OH 43224
North Linden NeighborhoodEstimated Value: $130,000 - $215,000
3
Beds
1
Bath
1,254
Sq Ft
$133/Sq Ft
Est. Value
About This Home
This home is located at 2727 Westerville Rd, Columbus, OH 43224 and is currently estimated at $167,126, approximately $133 per square foot. 2727 Westerville Rd is a home located in Franklin County with nearby schools including Linden STEM Academy (K-6), Linden-Mckinley Stem School On Arcadia, and Focus Learning Academy of Central Columbus.
Ownership History
Date
Name
Owned For
Owner Type
Purchase Details
Closed on
Apr 26, 2021
Sold by
Kight Heather
Bought by
Uptown Homes Inc
Current Estimated Value
Purchase Details
Closed on
Jul 2, 2001
Sold by
Igwebuike Ebony
Bought by
Kight Heather
Purchase Details
Closed on
Nov 20, 2000
Sold by
Smith Deborah S
Bought by
Igwebuike Ebony
Purchase Details
Closed on
Sep 1, 1999
Sold by
Smith Deborah S
Bought by
Walker James W
Home Financials for this Owner
Home Financials are based on the most recent Mortgage that was taken out on this home.
Original Mortgage
$35,000
Interest Rate
8.5%
Mortgage Type
Seller Take Back
Purchase Details
Closed on
Sep 11, 1991
Create a Home Valuation Report for This Property
The Home Valuation Report is an in-depth analysis detailing your home's value as well as a comparison with similar homes in the area
Home Values in the Area
Average Home Value in this Area
Purchase History
| Date | Buyer | Sale Price | Title Company |
|---|---|---|---|
| Uptown Homes Inc | $63,000 | Crown Search Services | |
| Kight Heather | $67,500 | -- | |
| Igwebuike Ebony | $3,500 | Peterson Title Agency | |
| Walker James W | $35,000 | -- | |
| -- | -- | -- |
Source: Public Records
Mortgage History
| Date | Status | Borrower | Loan Amount |
|---|---|---|---|
| Previous Owner | Walker James W | $35,000 |
Source: Public Records
Tax History Compared to Growth
Tax History
| Year | Tax Paid | Tax Assessment Tax Assessment Total Assessment is a certain percentage of the fair market value that is determined by local assessors to be the total taxable value of land and additions on the property. | Land | Improvement |
|---|---|---|---|---|
| 2024 | $2,023 | $44,140 | $10,850 | $33,290 |
| 2023 | $1,998 | $44,135 | $10,850 | $33,285 |
| 2022 | $1,391 | $19,390 | $4,550 | $14,840 |
| 2021 | $1,032 | $19,390 | $4,550 | $14,840 |
| 2020 | $1,034 | $19,390 | $4,550 | $14,840 |
| 2019 | $917 | $14,740 | $4,550 | $10,190 |
| 2018 | $967 | $14,740 | $4,550 | $10,190 |
| 2017 | $1,018 | $14,740 | $4,550 | $10,190 |
| 2016 | $1,120 | $16,490 | $2,450 | $14,040 |
| 2015 | $1,020 | $16,490 | $2,450 | $14,040 |
| 2014 | $1,022 | $16,490 | $2,450 | $14,040 |
| 2013 | $593 | $19,390 | $2,870 | $16,520 |
Source: Public Records
Map
Nearby Homes
- 1853 E Lakeview Ave
- 1691 E Weber Rd
- 1827 Aberdeen Ave
- 2765 Joyce Ave
- 1669 Manchester Ave
- 00 Minnesota Ave
- 01 Minnesota Ave
- 1326 Minnesota Ave
- 2771 Fern Ave
- 1967 Denune Ave
- 1591-1593 E Weber Rd
- 1875 Minnesota Ave
- 1615 Minnesota Ave
- 1985 Aberdeen Ave
- 1671 E Brighton Rd
- 1525 Aberdeen Ave
- 1547 Minnesota Ave
- 1940 Eddystone Ave
- 1841 E North Broadway St
- 1609 Arlington Ave
- 0 Westerville Rd
- 2721 Westerville Rd
- 2719 Westerville Rd
- 2735 Westerville Rd
- 2711 Westerville Rd
- 1796 Melrose Ave
- 1794 Melrose Ave
- 1800 Melrose Ave Unit 802
- 1800 Melrose Ave Unit 1802
- 1800 Melrose Ave Unit 2
- 2740 Westerville Rd
- 1784 Melrose Ave
- 2742 Cleveland Ave Unit 744
- 2753 Westerville Rd
- 2750 Cleveland Ave
- 2738 Cleveland Ave
- 2722-2724 Westerville Rd
- 2722 Westerville Rd
- 2757 Westerville Rd
- 2750 Westerville Rd