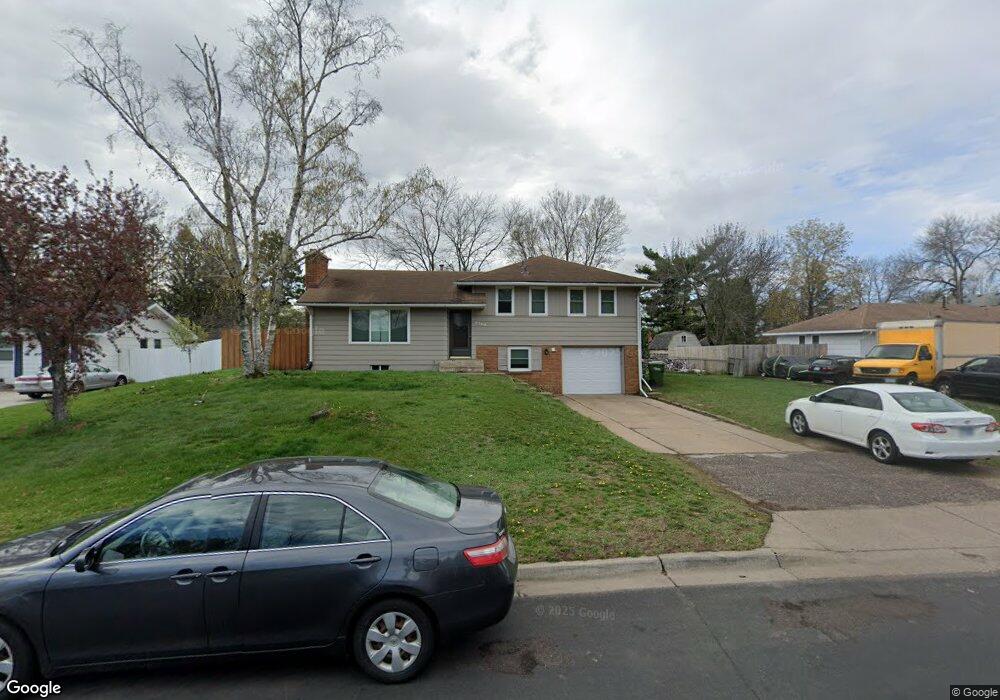
2728 119th Ave NW Coon Rapids, MN 55433
Estimated Value: $327,000 - $346,698
4
Beds
3
Baths
1,920
Sq Ft
$175/Sq Ft
Est. Value
About This Home
This home is located at 2728 119th Ave NW, Coon Rapids, MN 55433 and is currently estimated at $335,675, approximately $174 per square foot. 2728 119th Ave NW is a home located in Anoka County with nearby schools including Lucile Bruner Elementary School, Morris Bye Elementary School, and Laughlin Junior/Senior High School.
Ownership History
Date
Name
Owned For
Owner Type
Purchase Details
Closed on
May 2, 2022
Sold by
Xiong Cheng and Xiong Kathryn
Bought by
Berinyuy Godlove and Yensinvem Samiratu
Current Estimated Value
Home Financials for this Owner
Home Financials are based on the most recent Mortgage that was taken out on this home.
Original Mortgage
$294,500
Outstanding Balance
$276,840
Interest Rate
4.16%
Mortgage Type
New Conventional
Estimated Equity
$58,835
Purchase Details
Closed on
Jun 26, 2015
Sold by
Lind Travis Travis
Bought by
Xiong Cheng Cheng
Home Financials for this Owner
Home Financials are based on the most recent Mortgage that was taken out on this home.
Original Mortgage
$186,558
Interest Rate
4.09%
Mortgage Type
FHA
Purchase Details
Closed on
Mar 28, 2002
Sold by
Olson Arlene N
Bought by
Lind Travis and Lind Kelli
Create a Home Valuation Report for This Property
The Home Valuation Report is an in-depth analysis detailing your home's value as well as a comparison with similar homes in the area
Home Values in the Area
Average Home Value in this Area
Purchase History
| Date | Buyer | Sale Price | Title Company |
|---|---|---|---|
| Berinyuy Godlove | $310,000 | -- | |
| Xiong Cheng Cheng | $190,000 | -- | |
| Xiong Cheng Leng | $205,454 | Executive Title | |
| Lind Travis | $162,000 | -- |
Source: Public Records
Mortgage History
| Date | Status | Borrower | Loan Amount |
|---|---|---|---|
| Open | Berinyuy Godlove | $294,500 | |
| Previous Owner | Xiong Cheng Leng | $186,558 | |
| Previous Owner | Xiong Cheng Cheng | $182,838 |
Source: Public Records
Tax History Compared to Growth
Tax History
| Year | Tax Paid | Tax Assessment Tax Assessment Total Assessment is a certain percentage of the fair market value that is determined by local assessors to be the total taxable value of land and additions on the property. | Land | Improvement |
|---|---|---|---|---|
| 2025 | $3,034 | $283,300 | $84,000 | $199,300 |
| 2024 | $3,034 | $295,300 | $87,000 | $208,300 |
| 2023 | $2,705 | $289,200 | $76,000 | $213,200 |
| 2022 | $2,573 | $281,100 | $67,000 | $214,100 |
| 2021 | $2,435 | $240,100 | $67,000 | $173,100 |
| 2020 | $2,403 | $223,500 | $62,000 | $161,500 |
| 2019 | $2,213 | $212,500 | $60,000 | $152,500 |
| 2018 | $2,150 | $192,300 | $0 | $0 |
| 2017 | $1,795 | $182,200 | $0 | $0 |
| 2016 | $1,700 | $144,800 | $0 | $0 |
| 2015 | -- | $144,800 | $45,000 | $99,800 |
| 2014 | -- | $125,200 | $36,500 | $88,700 |
Source: Public Records
Map
Nearby Homes
- 11835 Crocus St NW
- 11749 Crooked Lake Blvd NW
- 12019 Zion St NW
- 11809 Zion St NW
- 3020 117th Ave NW
- 3074 121st Ave NW
- 12189 Lily St NW
- 2851 113th Ave NW
- 11984 Orchid St NW
- 11409 Quinn St NW
- 3501 115th Ln NW
- 2675 128th Ave NW
- 11444 Hanson Blvd NW
- 2687 128th Ave NW
- 11424 Hanson Blvd NW
- 2186 125th Ln NW
- 2068 124th Ln NW
- 11681 Tulip St NW
- 2147 125th Ln NW
- 11927 Vintage St NW
- 2718 119th Ave NW
- 2738 119th Ave NW
- 11818 Crocus St NW
- 11812 Crocus St NW
- 2725 119th Ave NW
- 2733 119th Ave NW
- 2717 119th Ave NW
- 2741 119th Ave NW
- 11841 Crooked Lake Blvd NW
- 11833 Crooked Lake Blvd NW
- 2709 119th Ave NW
- 11824 Crocus St NW
- 11825 Crooked Lake Blvd NW
- 11836 Crocus St NW
- 11901 Crooked Lake Blvd NW
- 11848 Crocus St NW
- 11806 Crocus St NW
- 11817 Crooked Lake Blvd NW
- 11900 Crocus St NW
- 11800 Crocus St NW