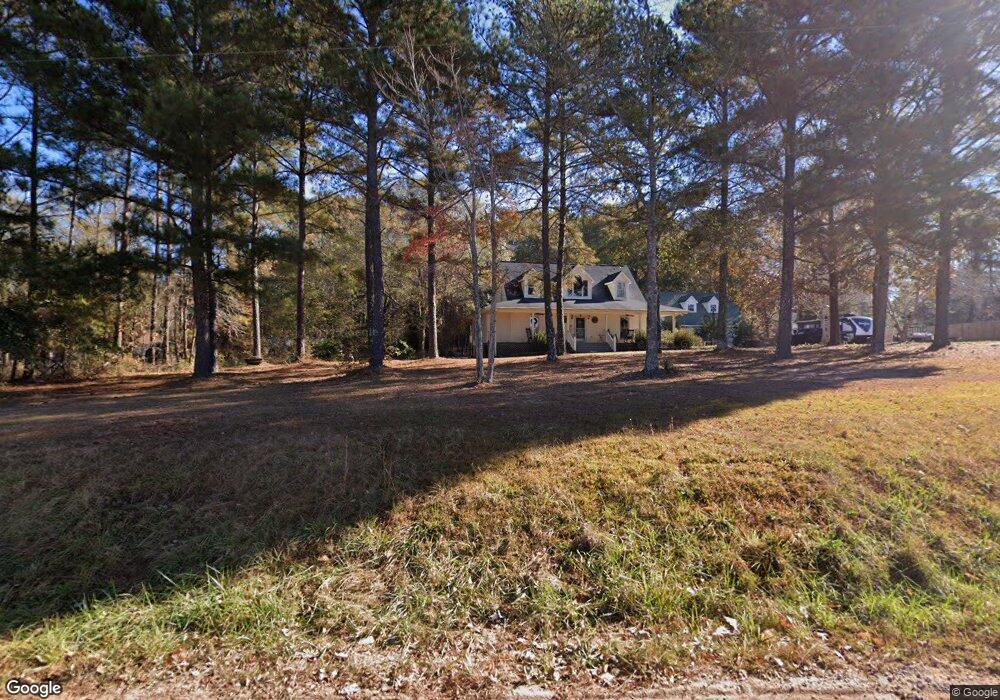
2728 Caldwell Rd Zebulon, GA 30295
Estimated Value: $382,805 - $457,000
3
Beds
3
Baths
1,942
Sq Ft
$214/Sq Ft
Est. Value
About This Home
This home is located at 2728 Caldwell Rd, Zebulon, GA 30295 and is currently estimated at $415,451, approximately $213 per square foot. 2728 Caldwell Rd is a home located in Pike County with nearby schools including Pike County Primary School, Pike County Elementary School, and Pike County Middle School.
Ownership History
Date
Name
Owned For
Owner Type
Purchase Details
Closed on
Jan 27, 2025
Sold by
Shaw Phillip M
Bought by
Shaw Phillip M and Shaw Susan
Current Estimated Value
Home Financials for this Owner
Home Financials are based on the most recent Mortgage that was taken out on this home.
Original Mortgage
$442,124
Outstanding Balance
$439,466
Interest Rate
6.85%
Mortgage Type
VA
Estimated Equity
-$24,015
Purchase Details
Closed on
Jul 20, 2020
Sold by
Chapman Frances Hollie
Bought by
Shaw Phillip
Home Financials for this Owner
Home Financials are based on the most recent Mortgage that was taken out on this home.
Original Mortgage
$272,803
Interest Rate
3.1%
Mortgage Type
VA
Purchase Details
Closed on
Oct 30, 2019
Sold by
Guy Dana B
Bought by
Chapman Frances Hollie
Home Financials for this Owner
Home Financials are based on the most recent Mortgage that was taken out on this home.
Original Mortgage
$189,477
Interest Rate
3.65%
Purchase Details
Closed on
Dec 10, 1993
Bought by
Guy Calvin E and Guy Dana B
Create a Home Valuation Report for This Property
The Home Valuation Report is an in-depth analysis detailing your home's value as well as a comparison with similar homes in the area
Home Values in the Area
Average Home Value in this Area
Purchase History
| Date | Buyer | Sale Price | Title Company |
|---|---|---|---|
| Shaw Phillip M | -- | -- | |
| Shaw Phillip | $282,500 | -- | |
| Chapman Frances Hollie | $150,000 | -- | |
| Guy Calvin E | -- | -- |
Source: Public Records
Mortgage History
| Date | Status | Borrower | Loan Amount |
|---|---|---|---|
| Open | Shaw Phillip M | $442,124 | |
| Previous Owner | Shaw Phillip | $272,803 | |
| Previous Owner | Chapman Frances Hollie | $189,477 |
Source: Public Records
Tax History Compared to Growth
Tax History
| Year | Tax Paid | Tax Assessment Tax Assessment Total Assessment is a certain percentage of the fair market value that is determined by local assessors to be the total taxable value of land and additions on the property. | Land | Improvement |
|---|---|---|---|---|
| 2024 | $3,223 | $131,967 | $18,833 | $113,134 |
| 2023 | $3,774 | $131,966 | $18,833 | $113,133 |
| 2022 | $2,796 | $98,262 | $14,487 | $83,775 |
| 2021 | $2,368 | $95,009 | $11,234 | $83,775 |
| 2020 | $1,823 | $94,782 | $11,234 | $83,548 |
| 2019 | $2,336 | $69,574 | $6,608 | $62,966 |
| 2018 | $2,338 | $69,574 | $6,608 | $62,966 |
| 2017 | $2,249 | $67,522 | $6,608 | $60,914 |
| 2016 | $2,087 | $67,522 | $6,608 | $60,914 |
| 2015 | $1,986 | $67,522 | $6,608 | $60,914 |
| 2014 | $2,015 | $67,522 | $6,608 | $60,914 |
| 2013 | -- | $67,522 | $6,608 | $60,914 |
Source: Public Records
Map
Nearby Homes
- 159 May Ln
- 218 Quail Dr
- 616 Shackelford Rd
- 76 Abbey Ct
- 567 Kendrick Rd
- 121 Cambridge Dr S
- 2088 Gresham Rd
- 1605 Shackelford Rd
- 534 Deer Lake Dr
- 1407 Patton Rd
- 143 Buck Trail
- 14375 U S 19
- 394 Hunter Rd
- TRACT 3 Grady Maddox Rd
- 15046 U S 19
- TRACT D Hunter Rd
- 2654 New Hope Rd
- 210 Hidden Falls Walk
- 15390 U S Highway 19 Hwy
- 219 Timber Wolf Trail