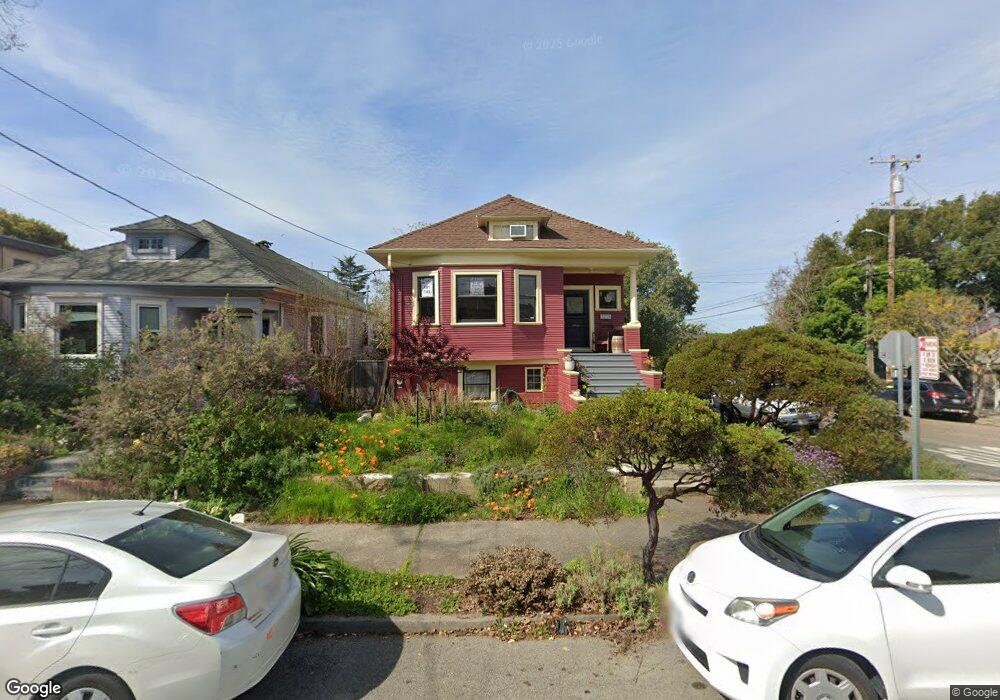
2728 Grant St Berkeley, CA 94703
South Berkeley NeighborhoodEstimated Value: $1,146,000 - $1,570,000
4
Beds
3
Baths
1,763
Sq Ft
$756/Sq Ft
Est. Value
About This Home
This home is located at 2728 Grant St, Berkeley, CA 94703 and is currently estimated at $1,333,049, approximately $756 per square foot. 2728 Grant St is a home located in Alameda County with nearby schools including Malcolm X Elementary School, Emerson Elementary School, and John Muir Elementary School.
Ownership History
Date
Name
Owned For
Owner Type
Purchase Details
Closed on
Jan 16, 2015
Sold by
Walker Owen F and Walker Rachel Z
Bought by
The Walker Family Trust
Current Estimated Value
Purchase Details
Closed on
Feb 17, 2005
Sold by
Dudley Tom and Dantonio Carla
Bought by
Walker Owen F and Walker Rachel Z
Home Financials for this Owner
Home Financials are based on the most recent Mortgage that was taken out on this home.
Original Mortgage
$320,000
Outstanding Balance
$162,437
Interest Rate
5.73%
Mortgage Type
Purchase Money Mortgage
Estimated Equity
$1,170,612
Create a Home Valuation Report for This Property
The Home Valuation Report is an in-depth analysis detailing your home's value as well as a comparison with similar homes in the area
Home Values in the Area
Average Home Value in this Area
Purchase History
| Date | Buyer | Sale Price | Title Company |
|---|---|---|---|
| The Walker Family Trust | -- | None Available | |
| Walker Owen F | $650,000 | Placer Title Company |
Source: Public Records
Mortgage History
| Date | Status | Borrower | Loan Amount |
|---|---|---|---|
| Open | Walker Owen F | $320,000 | |
| Closed | Walker Owen F | $200,000 |
Source: Public Records
Tax History
| Year | Tax Paid | Tax Assessment Tax Assessment Total Assessment is a certain percentage of the fair market value that is determined by local assessors to be the total taxable value of land and additions on the property. | Land | Improvement |
|---|---|---|---|---|
| 2025 | $15,663 | $960,466 | $271,787 | $695,679 |
| 2024 | $15,663 | $941,502 | $266,459 | $682,043 |
| 2023 | $15,329 | $929,906 | $261,235 | $668,671 |
| 2022 | $15,030 | $904,677 | $256,114 | $655,563 |
| 2021 | $15,053 | $886,804 | $251,093 | $642,711 |
| 2020 | $14,169 | $884,641 | $248,519 | $636,122 |
| 2019 | $13,533 | $867,302 | $243,648 | $623,654 |
| 2018 | $13,293 | $850,303 | $238,873 | $611,430 |
| 2017 | $13,107 | $833,636 | $234,191 | $599,445 |
| 2016 | $10,918 | $725,000 | $217,500 | $507,500 |
Source: Public Records
Map
Nearby Homes
- 2701 Grant St
- 1612 Carleton St
- 1901 Parker St Unit 3
- 2926 Ellis St
- 1612 Parker St
- 1530 Stuart St
- 1515 Derby St
- 1646 Ashby Ave
- 1535 Julia St
- 1645 Dwight Way
- 2750 Sacramento St
- 2758 Sacramento St
- 2774 Sacramento St
- 2782 Sacramento St
- 2790 Sacramento St
- 1450 Ward St
- 2018 Blake St
- 2057 Emerson St
- 2110 Ashby Ave
- 2922 Stanton St
Your Personal Tour Guide
Ask me questions while you tour the home.